Designing a Unified Observability Platform
A system design interview guide to unifying the three pillars — metrics, logs, and traces — into one platform that ingests, correlates, and queries telemetry across a fleet, replacing a pile of fragmented legacy monitoring tools.
Most organizations grow their monitoring by accretion: a metrics system here, a log aggregator there, a tracing tool bolted on later, each with its own agents, storage, query language, and dashboards. The result is that during an incident an engineer hops between three tools that cannot talk to each other, manually copying timestamps and IDs to correlate what happened. A unified observability platform fixes this by collecting all three signal types through one pipeline, storing each in a backend suited to its shape, and — the key move — stitching them together with shared identifiers so you can pivot from a metric spike to the exact trace to the exact logs in a couple of clicks. This guide builds that platform: the pillars and their data model, a single collection layer built on OpenTelemetry, per-signal storage, the correlation glue, and the hard problems of high cardinality, multi-tenancy, and cost.
Contents
1. Requirements & Scope
The goal is one platform that answers the three questions an operator asks during an incident: is something wrong? (metrics), what exactly happened? (logs), and where in the request path? (traces). Scope it as functional and non-functional requirements.
- Functional. Ingest metrics, logs, and traces from every service and host; store each with an appropriate retention; expose query, dashboards, and alerting over all three; and let a user pivot between signals via shared context.
- Vendor-neutral collection. One instrumentation standard (OpenTelemetry) so applications are not coupled to a backend and signals arrive in a common format.
- Scale. Millions of metric series, terabytes of logs per day, and a firehose of spans — with ingest that never blocks the applications producing telemetry.
- Query latency. Dashboards and alert evaluations return in well under a second on recent data; ad-hoc historical queries in seconds.
- Multi-tenancy & cost. Many teams share the platform with isolation and quotas, and the whole thing must be affordable — telemetry volume routinely rivals the size of the production traffic it observes.
2. Back-of-the-Envelope Estimates
Sizing tells you where the money and the engineering go. Assume a mid-large fleet of 10,000 hosts running 50,000 service instances, serving 1,000,000 requests/second at peak.
| Signal | Estimate | Volume math |
|---|---|---|
| Metrics | ~20M active series; ~20M samples/s at 1s scrape | 50k instances × ~400 series each ≈ 20M series; each emitted per second. |
| Metrics storage | ~35 GB/day compressed | 20M samples/s × 86,400s × ~2 bytes/sample (Gorilla-style) ≈ 3.5×10¹² B → downsampled tiers keep years cheaply. |
| Logs | ~10M lines/s; ~5–10 TB/day | 1M req/s × ~10 log lines/request × ~500 bytes × 86,400s, before compression. |
| Traces (spans) | ~10M spans/s raw; ~100k/s kept | 1M req/s × ~10 spans/request; sampled at ~1% → ~100k spans/s stored. |
| Trace storage | ~1–2 TB/day kept | 100k spans/s × 86,400s × ~1–2 KB/span; sampling is what makes this affordable. |
The estimate immediately explains three design decisions: metrics compress fantastically and are cheap to keep, so they are the always-on layer; logs are the bulk of raw bytes, so tiering and cheap object storage dominate their design; and traces are so voluminous raw that sampling is mandatory, not optional. Each pillar therefore gets a different storage strategy.
3. The Three Pillars & Data Model
Each pillar answers a different question and has a different data shape, which is precisely why one storage engine cannot serve all three well.
- Metrics. Numeric measurements aggregated over time — request rate, error rate, p99 latency, CPU. Cheap, always on, low-dimensional. Identified by a name plus a set of key-value labels; the name-plus-labels defines one time series. Great for “is something wrong and how much?” but they tell you nothing about an individual request.
- Logs. Discrete, timestamped event records, ideally structured (JSON) with fields. High volume, high detail. Great for “what exactly happened?” on a specific event, at the cost of being expensive to store and search at scale.
- Traces. The causal record of one request as it flows across services — a tree of spans, each a timed unit of work with a
trace_id,span_id, and parent link. Great for “where did the latency go?” across a distributed call path.
| Pillar | Shape | Answers | Storage fit |
|---|---|---|---|
| Metrics | name + labels → (ts, value) | Is it broken? How much? | Time-series DB (TSDB). |
| Logs | timestamp + structured fields | What exactly happened? | Inverted index and/or columnar. |
| Traces | tree of spans by trace_id | Where in the path? | Key-by-trace_id store on object storage. |
The unifying thread is context: every signal carries a common set of resource attributes (service, host, region) and, wherever it originates inside a request, the trace_id and span_id. That shared context is what later lets the platform join a metric, a log, and a trace that describe the same moment.
4. High-Level Architecture
The platform is a pipeline: instrument once, collect through one layer, route each signal to its own store, and query and alert over all of them with a correlation layer on top.
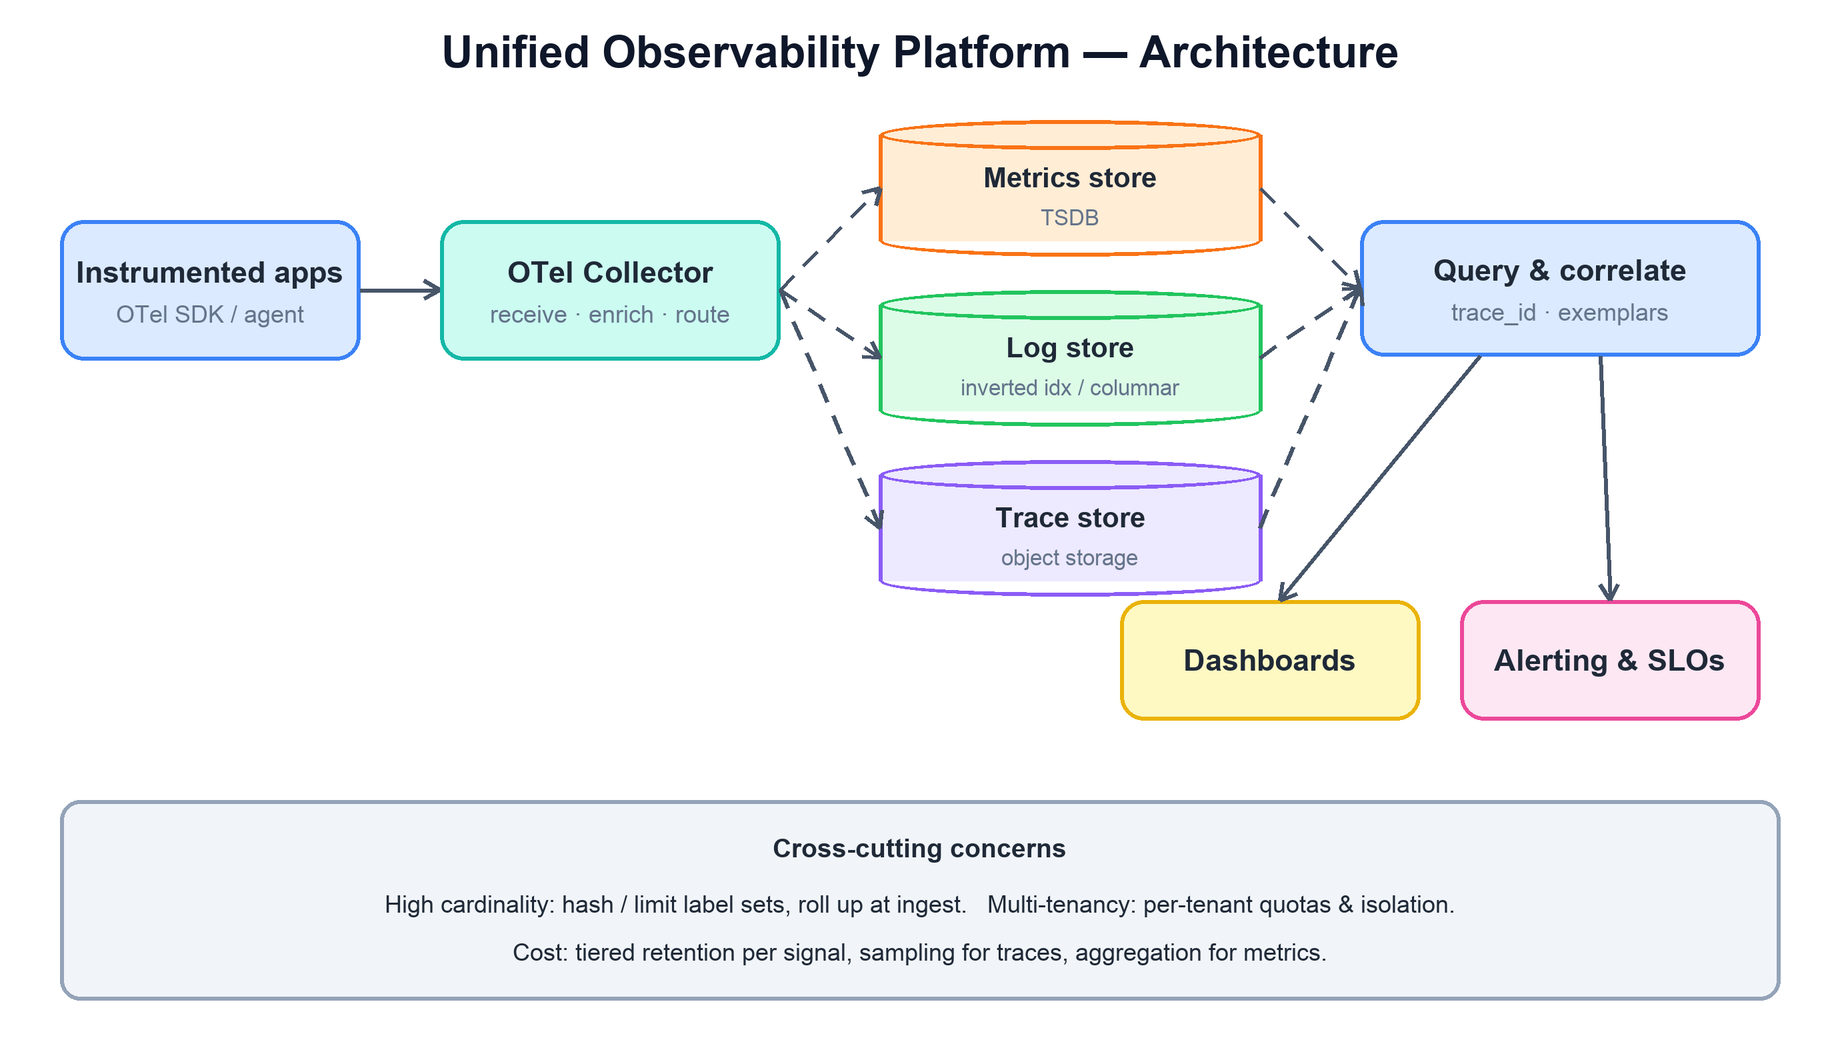
The design deliberately splits collection from storage from query. Collection is a common front door so applications never know or care which backend stores their telemetry. Storage is specialized per signal because their access patterns differ so sharply. And the query layer sits above all three stores so a single UI can correlate them. This separation is exactly what a fragmented legacy setup lacks — there, each tool owns its own collection, storage, and query, and nothing joins across them.
5. Collection & OpenTelemetry Ingest
The foundation is OpenTelemetry (OTel), the vendor-neutral standard for instrumenting and shipping telemetry. It matters because it decouples applications from backends: instrument once against the OTel API, and you can change or fan out to any storage backend without touching application code. Two components do the work.
- OTel SDK. Embedded in each application, it produces metrics, logs, and spans in the common OTLP wire format and propagates context (the
trace_id) across service boundaries. - OTel Collector. A standalone process — run as a per-host agent and/or a central gateway — built as a pipeline of receivers (accept OTLP and legacy formats), processors (batch, enrich with resource attributes, redact, tail-sample, drop), and exporters (write to each backend). It shields applications from the storage tier and is where you apply cross-cutting policy centrally.
# OTel Collector pipeline: receivers -> processors -> exporters
receivers:  [ otlp, prometheus, filelog ]     # accept many sources
processors: [ batch,                           # group for efficient writes
              resource,                        # add service/host/region tags
              redaction,                       # scrub secrets / PII
              tail_sampling ]                  # keep errors + slow traces
exporters:  { metrics: tsdb, logs: log_store, # route per signal
              traces: trace_store }
Running the collector as an agent on each host offloads batching, retry, and buffering from the application and gives you one place to enforce policy; a central gateway tier then handles cross-host concerns like tail sampling (which needs all spans of a trace) and tenant routing. Buffering with retry in the collector is what keeps a storage backend hiccup from ever backing pressure into — and slowing — the production applications.
6. Storage Per Signal
Each pillar gets a store matched to its shape. Forcing all three into one engine is the classic mistake that makes a platform either slow or ruinously expensive.
Metrics → time-series database
Metrics are stored in a TSDB optimized for append-heavy writes and range-scan reads over (timestamp, value) pairs. It uses an inverted index on labels to select series, delta-of-delta timestamp and XOR value compression to shrink the data dramatically, and downsampling into coarser resolutions as data ages so years of history stay cheap. (See the companion time-series store guide for the internals.)
Logs → inverted index and/or columnar
Logs need full-text and field search, so they go into an inverted index (Lucene-style, as in Elasticsearch/OpenSearch) for recent data, and increasingly into a columnar format (Parquet on object storage) for older data and analytical scans. Indexing every field is expensive, so a cost-conscious design indexes a few high-value fields and stores the rest as compressed columns queried by scan. (See the companion log search guide.)
Traces → key-by-trace_id store
Spans are written keyed by trace_id so that all spans of a request can be fetched together to reassemble the trace. Because span volume is enormous, the store is backed by cheap object storage with a small index from trace_id (and searchable attributes) to the blocks that hold its spans — the model used by systems like Grafana Tempo. (See the companion distributed tracing guide.)
7. Correlation via Trace IDs & Exemplars
Correlation is the whole point of unifying the pillars, and it works because every signal carries shared context. Two mechanisms tie them together.
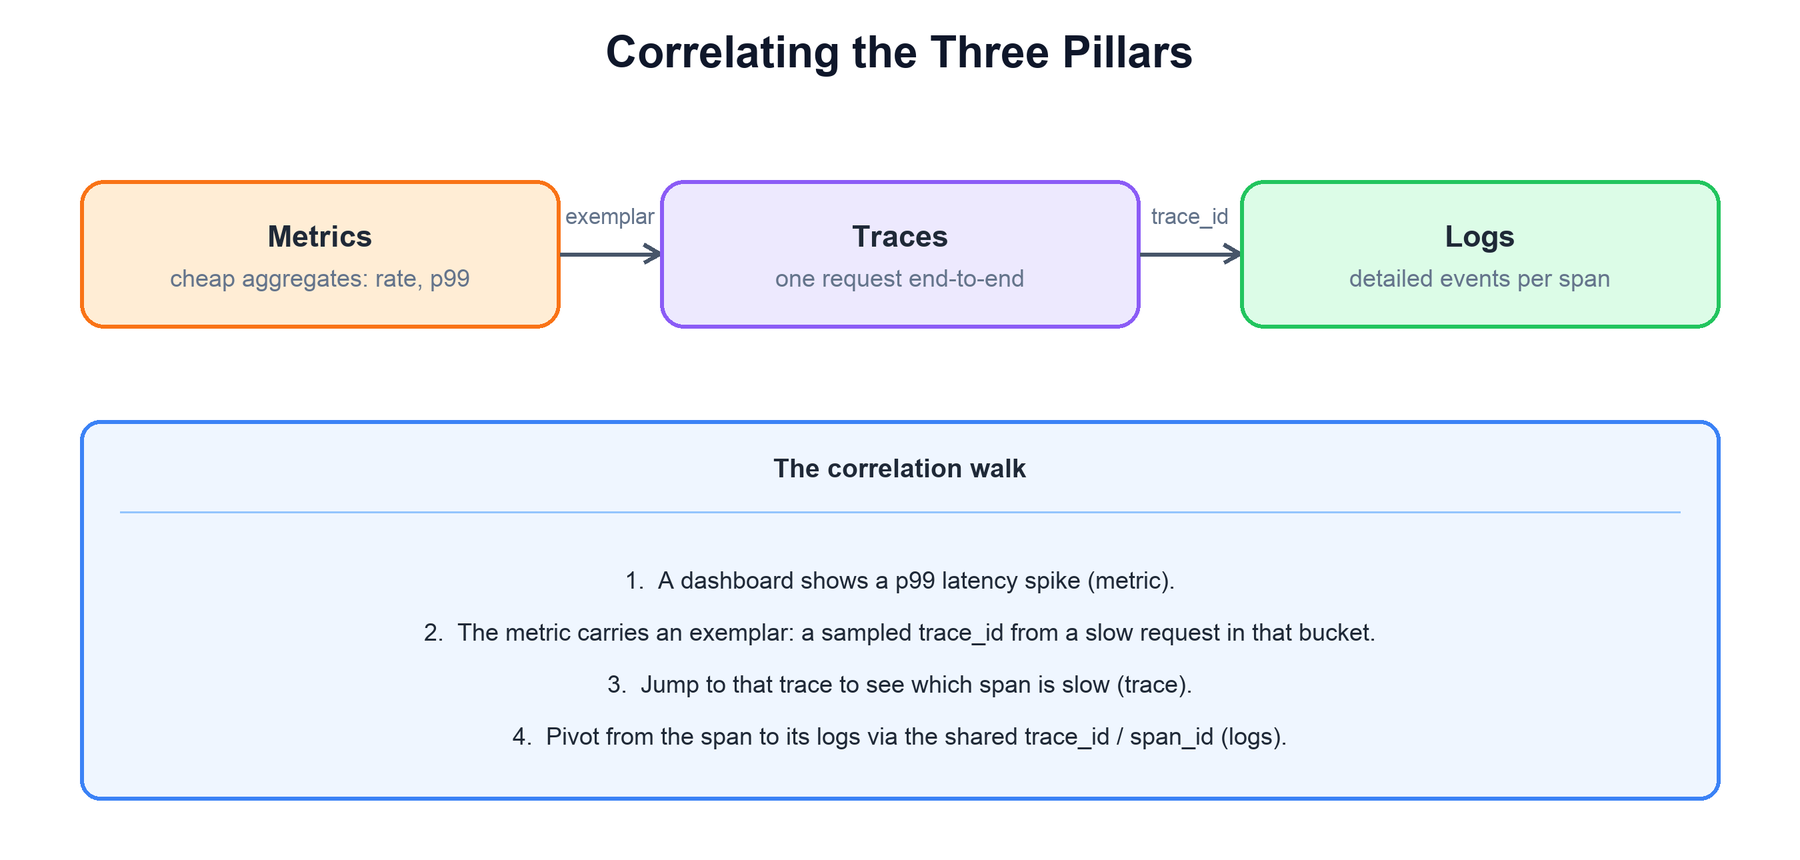
trace_id attached to a metric bucket — jumps you to a representative slow trace; from a span in that trace, the shared trace_id and span_id pivot you to the exact logs. The three pillars become one investigation.- Exemplars (metrics → traces). A metric aggregate like a latency histogram loses per-request detail by design. An exemplar attaches a sample
trace_idto a histogram bucket, so when a dashboard shows a p99 spike you can click straight through to an actual slow trace that landed in that bucket — bridging the aggregate world of metrics and the individual world of traces. - Trace/span IDs (traces ↔ logs). Because the OTel SDK injects the current
trace_idandspan_idinto every log line emitted during a request, you can pivot from any span to exactly the logs it produced, and from any log line back to its trace. This is the join key that turns three silos into one graph.
The investigation flow this enables — metric spike → exemplar → slow trace → span logs — is what an interviewer is really testing when they ask you to “unify” observability. Shared, propagated context is the mechanism; a common query layer over all three stores is what surfaces it.
8. Cardinality, Multi-Tenancy & Cost
Three hard problems dominate operating such a platform, and naming them shows you have run one, not just drawn one.
High cardinality
Cardinality — the number of distinct label combinations — is the metrics killer. A single label with unbounded values (a user id, a request id, a raw URL with parameters) mints a new series per value and blows up the index and memory until the TSDB falls over. The same problem hits log fields and trace attributes. Defenses: keep labels bounded and low-cardinality, drop or hash high-cardinality dimensions at the collector, and enforce per-metric series limits so one misbehaving service cannot take the platform down.
Multi-tenancy
Many teams share one platform, so it needs isolation: per-tenant ingestion quotas and rate limits, so one team’s flood does not starve another; per-tenant data isolation for access control; and fair-scheduling of expensive queries so a heavy dashboard from one tenant does not stall everyone’s alerts.
Cost
Telemetry volume rivals production traffic, so cost control is a first-class design axis, not an afterthought: tiered retention per signal (hot on fast media, warm/cold on object storage), aggressive downsampling for metrics, sampling for traces, indexing only high-value log fields, and letting users trade fidelity for cost per tenant. The strong framing is that observability spend must be governed against the value it delivers, the same way an error budget governs reliability spend.
9. Summary
A unified observability platform collects all three signals through one standard pipeline, stores each in a backend matched to its shape, and — the differentiator — correlates them with shared context so investigation is one flow instead of three.
| Concern | Mechanism |
|---|---|
| What are the pillars? | Metrics (is it broken?), logs (what happened?), traces (where in the path?) — three views of the same events. |
| How do we instrument once? | OpenTelemetry SDK + Collector (receivers → processors → exporters) decouple apps from backends. |
| Where does each signal live? | TSDB for metrics, inverted-index/columnar for logs, key-by-trace_id object store for traces. |
| How do the pillars connect? | Exemplars link metrics → traces; shared trace_id/span_id link traces ↔ logs. |
| What breaks it at scale? | High cardinality — bound labels, drop/hash at ingest, enforce per-series limits. |
| How do many teams share it? | Per-tenant quotas, isolation, and fair query scheduling. |
| How do we afford it? | Tiered retention, downsampling, trace sampling, index only high-value fields. |