Designing a Logging / Analytics Pipeline
A system design interview guide to building a pipeline that collects logs and events from thousands of services and lands them, without loss or duplication, in the stores that engineers and analysts actually query.
Almost every company eventually arrives at the same realization: the data describing how the system behaves — request logs, error traces, business events — is at least as valuable as the data the system was built to serve. A logging or analytics pipeline is the plumbing that captures that exhaust from every running process and delivers it to the places people query it: a search store for debugging an incident at 3 a.m., a warehouse for the analyst building a dashboard, and cheap archival storage for the auditor who needs last year's records. The naive approach — have each service write straight to the destination — collapses the moment you have many producers, bursty traffic, or more than one consumer. This guide builds the pipeline up the way it actually has to be built: collect at the edge, buffer in the middle, process the stream, and fan out to several sinks, with delivery guarantees and ordering handled deliberately at each step.
Contents
1. Sources of Data
The first thing to be precise about is what is actually flowing into the pipeline, because the two main kinds of data have different shapes and different downstream uses. Lumping them together as "logs" hides design decisions you will later wish you had made on purpose.
| Kind | Example | Shape | Primarily for |
|---|---|---|---|
| Application logs | "connection refused, retrying", a stack trace | Often free-form text lines, sometimes with a severity and timestamp | Debugging and incident response |
| Structured events | "checkout_completed" with amount, user, currency | A typed record with named fields, ideally schema-validated | Analytics, metrics, billing |
Application logs are what a human reads when something breaks; they are forgiving in format but enormous in volume. Structured events are what a query engine aggregates; they need consistent field names and types or every downstream analysis becomes a guessing game. A good pipeline accepts both but nudges producers toward structure: even a log line is far more useful when it carries a service name, a timestamp, a severity, and a trace id as proper fields rather than buried in a string. The earlier you impose a little structure, the less parsing and guesswork everything downstream has to do.
2. The Collection Agent
Once you accept that data is generated on thousands of hosts, the question becomes how to get it off those hosts reliably without coupling every application to the pipeline. The standard answer is a collection agent: a small, separate process that runs on each host (or as a sidecar next to each container), tails the application's log files or receives events over a local socket, and forwards them onward.
Running collection as a separate agent rather than inside the application buys a clean separation of concerns. The application's only job is to emit a line or an event locally and move on; it never blocks on the network and never needs to know where the data eventually goes. The agent handles the messy realities of shipping data: batching many small records into efficient payloads, compressing them, retrying when the next hop is unavailable, and buffering to local disk so that a brief outage downstream does not lose data or stall the application. Because the agent is uniform across the fleet, you can also use it to attach common metadata — host name, region, environment, service version — to every record without touching application code.
# agent runs on every host, tails sources and forwards in batches
function agent_loop():
  buffer = []
  for record in tail(log_files) + recv(local_socket):
    record = enrich(record, host=hostname(), region=REGION)
    buffer.append(record)
    if buffer.full() or timer.expired():
      try:
        broker.send(compress(buffer))   # one batched, compressed call
        buffer.clear()
      except Unavailable:
        spill_to_disk(buffer)           # survive a downstream outage
3. End-to-End Architecture
With sources and agents established, the central design is the path a record takes from the host where it is born to the store where it is finally queried. The defining move is to insert a durable buffer between the producers and the consumers, so that the side generating data and the side reading it are completely decoupled and can fail, scale, or slow down independently.
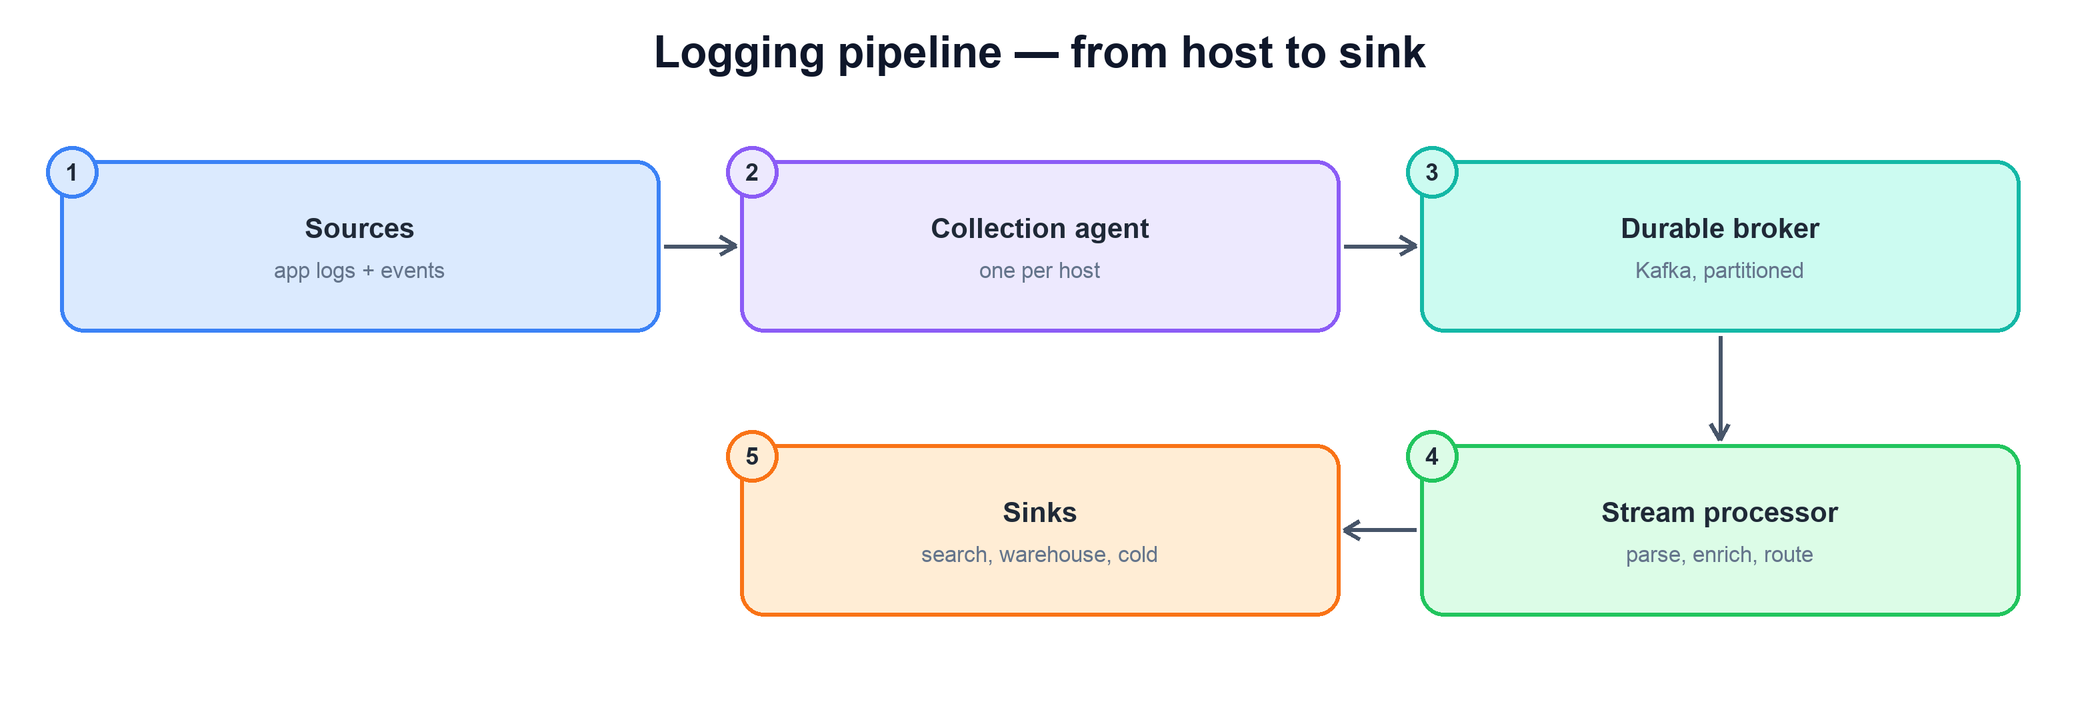
Reading the flow left to right:
- Sources and agents. Every host produces logs and events; its local agent batches, compresses, and ships them, so applications are never coupled to the rest of the pipeline.
- Durable broker. A partitioned, replicated log such as Kafka sits in the middle. Producers append to it and consumers read from it independently. It is the shock absorber: it persists records for a retention window, absorbs traffic spikes, and lets slow or restarting consumers catch up without dropping anything.
- Stream processors. A pool of consumers reads from the broker and does the real work — parsing raw lines into fields, enriching records with extra context, filtering noise, and routing each record to the sinks that should receive it.
- Sinks. The processed stream lands in several destinations at once, each tuned to a different access pattern: a search store for interactive debugging, a warehouse or lake for analytics, and cold object storage for long-term archive.
The single most important property of this shape is that the broker breaks the system into two halves that can be reasoned about — and operated — separately. A spike in producers, a slow sink, or a redeploy of the processors no longer ripples across the whole pipeline.
4. The Durable Buffer
The broker deserves its own section because it is what turns a fragile chain into a resilient system. Without it, every producer is directly coupled to every consumer: if the warehouse is slow, the applications writing to it slow down too, and a traffic spike that the sinks cannot absorb is simply lost. Putting a durable, append-only log in the middle changes all of that.
- Decoupling. Producers only need to know about the broker, and consumers only need to know about the broker. Either side can be redeployed, scaled, or fail without the other noticing. You can even add a brand-new consumer months later and have it read the existing data.
- Spike absorption. When events arrive faster than the sinks can accept them, the excess simply accumulates in the broker for its retention period and drains once the burst passes. The pipeline degrades into latency, not loss.
- Durability and replay. Because the broker persists and replicates records, a consumer that crashes can resume from its last committed position, and you can replay history — for example to backfill a new sink or to recover from a bug in a processor — by rewinding the read position.
5. Stream Processing
Raw records as they leave the agent are rarely in the form the sinks want. The stream processing layer is where they are transformed on the fly, record by record, as they flow from the broker to the sinks. Three jobs dominate this stage.
- Parse. Turn a raw log line into structured fields — extract the timestamp, severity, message, and any embedded key-value pairs — so that downstream stores can index and query them rather than treating each entry as opaque text.
- Enrich. Add context the source could not include: resolve a user id to a region, attach a deployment version, tag records with the data center, or join against a lookup table. Enrichment is what makes later analysis possible without re-deriving the same facts everywhere.
- Route and filter. Decide where each record goes. Debug-level chatter might go only to the search store with a short retention; billing events must go to the warehouse and the archive. Pure noise can be dropped here so it never costs storage downstream.
function process(record):
  record = parse(record)                  # text -> typed fields
  record = enrich(record, lookup_region)  # add context
  if is_noise(record):
    return                                 # drop, don't store
  for sink in route(record):              # fan out to chosen sinks
    sink.write(record)
Because processing runs as a horizontally scalable pool of consumers reading from the broker's partitions, it scales with traffic simply by adding more instances — up to the number of partitions, which is why partition count, discussed below, is a capacity decision and not just a correctness one.
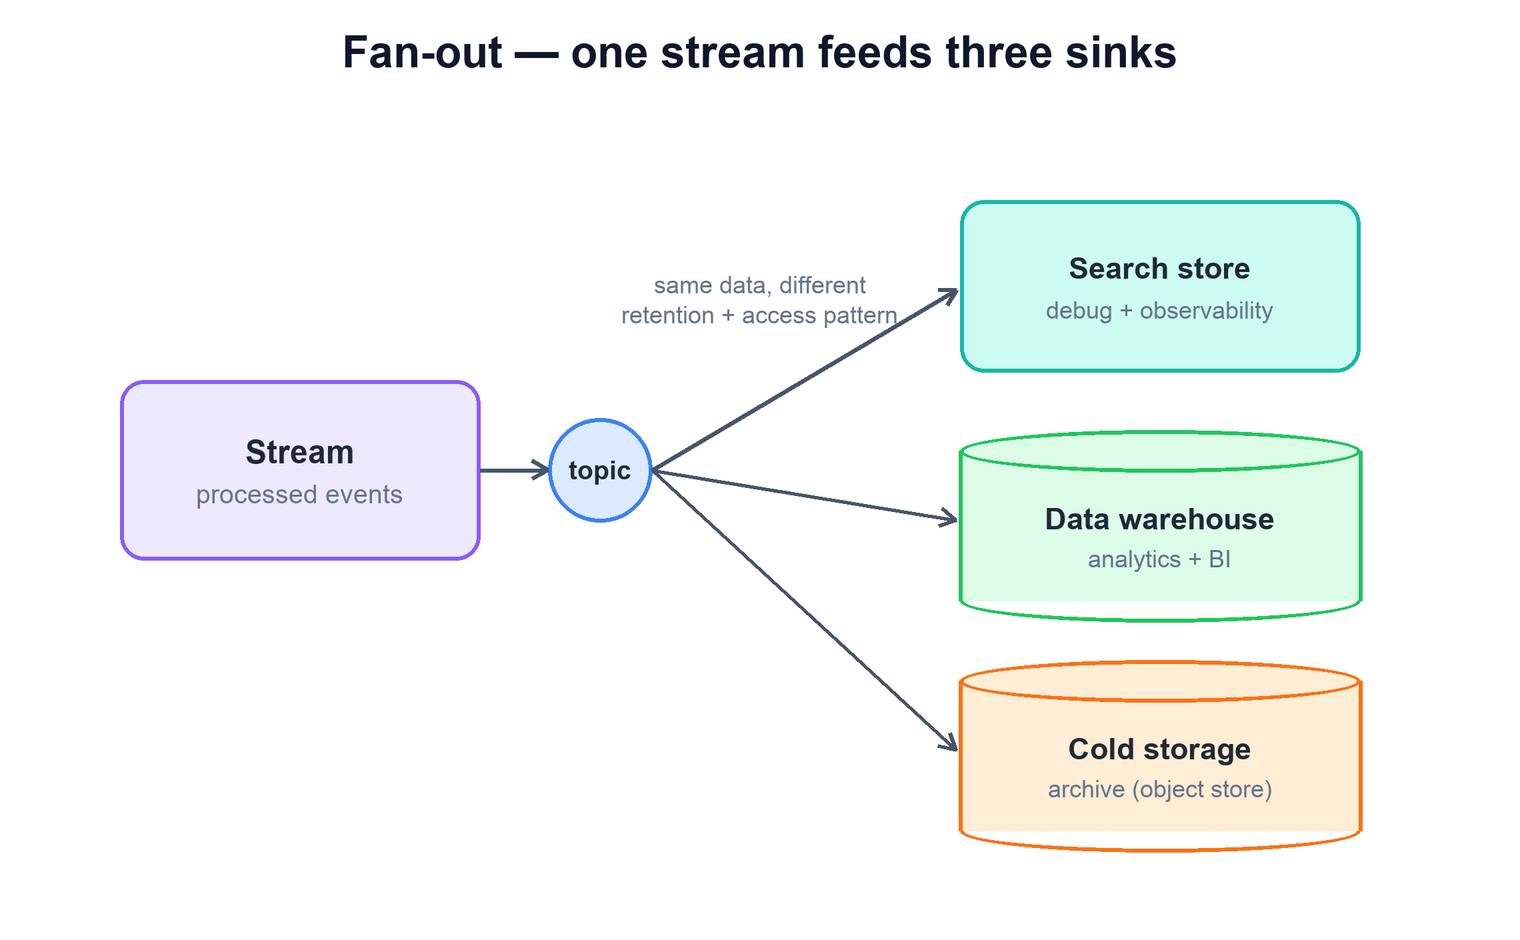
6. Sinks and Fan-Out
The same processed record usually needs to live in more than one place, because no single store is good at everything. This is the fan-out: one logical stream is written to several sinks, each chosen for a different access pattern, cost profile, and retention.
| Sink | Optimized for | Retention | Cost |
|---|---|---|---|
| Search / observability store | Full-text search, recent data, low-latency debugging | Days to weeks (hot) | High per GB |
| Data warehouse / lake | Aggregations, joins, dashboards, ad-hoc analytics | Months to years | Moderate |
| Cold object storage | Cheap, durable archive; compliance and replay | Years | Very low per GB |
Treating these as separate sinks rather than trying to force one store to do all three is what keeps each one affordable and fast at its job. The search store stays small and fast because it only holds recent hot data; the warehouse holds the structured events analysts care about; the archive holds everything cheaply for as long as policy requires. Routing decisions made in the processing layer determine which records reach which sink, so you are not paying search-store prices to store a year of debug logs.
7. Delivery Guarantees
The hard reliability question for any pipeline is what happens when something fails mid-flight, and the honest answer is that you generally choose at-least-once delivery and then remove the duplicates it produces. Exactly-once end to end across independent systems is expensive and often impossible; at-least-once plus dedup gets you the same observable result far more cheaply.
At-least-once means: a consumer only advances its committed read position after it has durably written a record to the sink. If it crashes before committing, it will reprocess from the last commit on restart — so nothing is lost, but some records may be written twice. To keep those duplicates from corrupting analytics, each record carries a stable unique id, and sinks deduplicate on it.
function consume_loop():
  for batch in broker.poll(partition):
    for record in batch:
      if not sink.seen(record.event_id):   # dedup on a stable id
        sink.write(record)
    broker.commit(batch.offset)            # commit AFTER the write
# crash before commit -> safe replay- Generate a stable id at the source. The id must be assigned once, by the producer or agent, and travel with the record — not regenerated downstream, or retries would look like new records.
- Commit after writing, never before. Committing the read position only after the sink write is what makes loss impossible; the cost is the occasional duplicate.
- Dedup at the sink (or with a window). Exact dedup needs the sink to recognize the id; an approximate dedup over a recent time window is often enough for log data and far cheaper.
8. Partitioning and Backpressure
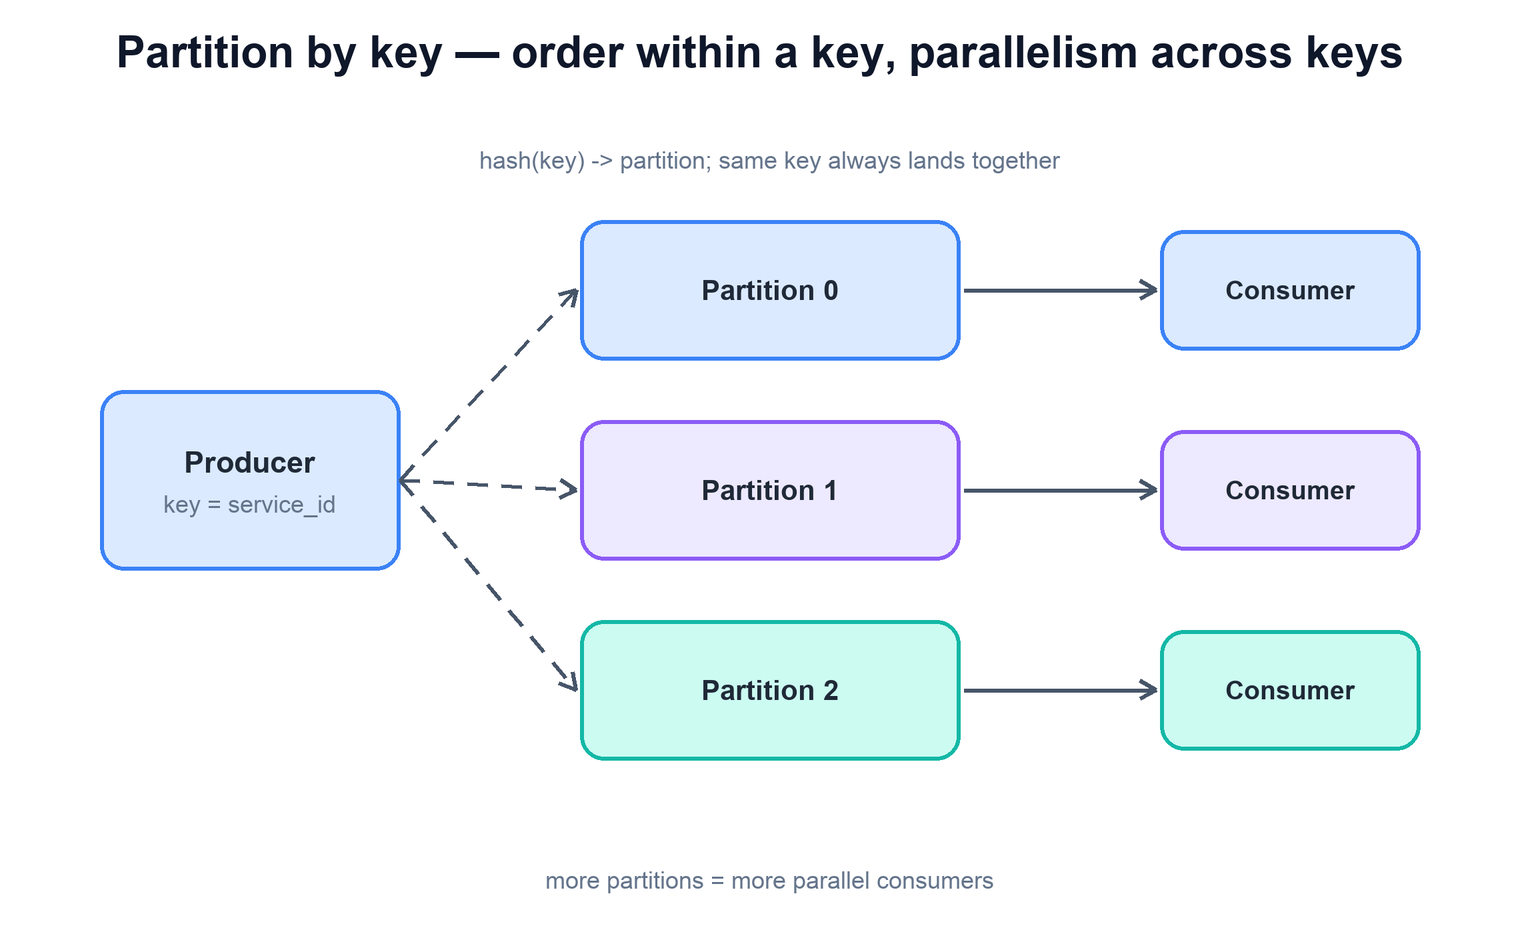
Two operational mechanisms make the pipeline both fast and stable: partitioning, which buys ordering and parallelism, and backpressure, which keeps a fast producer from drowning a slow consumer.
Partitioning. The broker splits each topic into partitions. Records are assigned to a partition by hashing a key — for example the service name or the user id. This gives two properties at once: records that share a key always land in the same partition and are therefore consumed in order, while different keys spread across partitions and are consumed in parallel. The number of partitions is the ceiling on how many consumers can work a topic simultaneously, so it is the main lever for throughput.
Backpressure. Because the broker decouples the two sides, a slow sink does not stall producers; instead the consumer's lag — how far its committed position trails the newest record — grows. That lag is the system's primary health signal. Rising lag tells you a sink or the processor pool is the bottleneck, and it gives you a graceful place to react: add consumers, shed or sample low-value records, or let the broker's retention hold the backlog until the burst passes. The pipeline turns overload into measurable latency rather than silent data loss.
9. Schema Management
The quiet failure mode of analytics pipelines is not an outage; it is the day a producer renames a field or changes a type and every downstream query silently starts returning wrong numbers. Because producers and consumers are decoupled and deployed independently, you need an explicit contract for the shape of structured events — a schema — and a discipline for evolving it.
- Register schemas centrally. A schema registry holds the canonical definition of each event type and its version. Producers serialize against a known schema; consumers deserialize against it. The registry becomes the single source of truth for what a "checkout_completed" event actually contains.
- Evolve compatibly. Adding an optional field is safe; renaming or removing one, or changing a type, breaks consumers that were written against the old shape. Enforce backward- and forward-compatible changes so old and new producers and consumers can coexist during a rollout.
- Validate at the edge. Reject or quarantine records that do not match a registered schema as early as possible — ideally at the agent or the first processor — so malformed data never silently poisons a downstream table.
Schema discipline is what lets the two halves of the pipeline evolve on their own schedules. With a registry and compatibility rules, a producer team can ship a new event version without a flag day, and the analysts querying the warehouse can trust that a column means today what it meant last quarter.
10. Summary
A logging and analytics pipeline is a decoupled transport that collects data at the edge, buffers it durably, transforms it in flight, and fans it out to purpose-built stores. Its design is a handful of reinforcing decisions:
| Concern | Mechanism |
|---|---|
| What flows in? | Two streams — high-volume application logs and typed structured events — sharing one ingestion path. |
| How does data leave the hosts? | A collection agent per host: batches, compresses, enriches, retries, and buffers locally. |
| How are producers decoupled from consumers? | A durable, partitioned broker (e.g. Kafka) in the middle that persists, replicates, and absorbs spikes. |
| How is raw data made useful? | Stream processors parse, enrich, filter, and route each record as it flows through. |
| Where does it land? | Fan-out to several sinks: a search store, a warehouse/lake, and cold object storage, each tuned differently. |
| How do we avoid loss and duplicates? | At-least-once delivery (commit after write) plus dedup on a stable per-record id. |
| How do we get ordering and parallelism? | Partition by key: same key in order, different keys in parallel; partition count caps throughput. |
| How do we handle overload? | Backpressure via consumer lag — overload becomes measurable latency, not silent loss. |
| How do we keep data correct over time? | A schema registry with compatible evolution and validation at the edge. |