04 · Operational Leadership
How to answer the operational-leadership questions in a senior engineering-leadership loop: the framework to structure each answer, what the interviewer is really listening for, and where inside Meta to pull the evidence that backs your story.
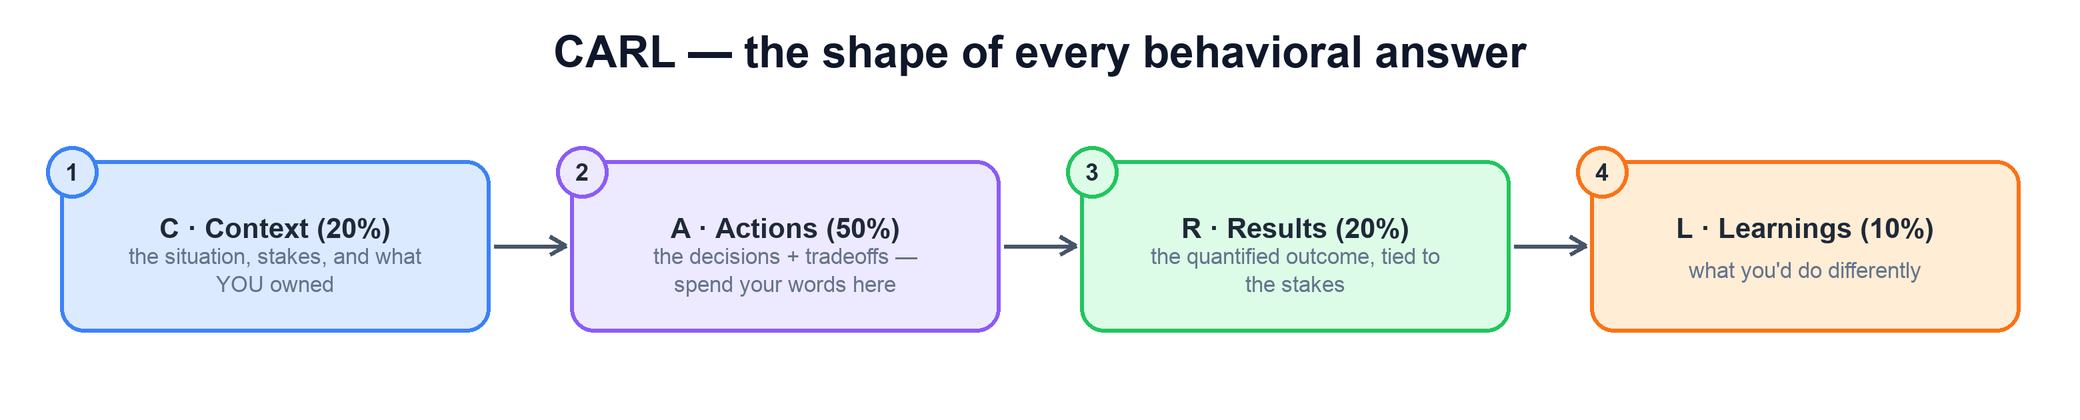
This area tests one thing: can you keep a system and a team healthy under load — reliably, cheaply, and at quality — week after week. Interviewers are not grading whether you can fight a single fire; they assume you can. They are grading operating judgment: did you watch the few metrics that matter, run a cadence that surfaces problems early, triage by impact when you can't do everything, assign clear ownership, and drive durable fixes instead of band-aids. Every answer below is built on the CARL shape — Context, Actions, Results, Learnings — with most of your words spent on the decisions and tradeoffs.
Questions on this page
- How to answer this area — the framework
- Run your team's operations and stay on top of health
- Drive a significant cost or efficiency improvement
- When everything is on fire — triage under pressure
- Set and hold a quality bar as the team grows
- Build an operational-review or metrics culture
- More questions you might get
- How do you decide which metrics are worth tracking — and which dashboards to delete?
- Tell me about a recurring incident. How did you break the cycle for good?
- How do you balance reliability investment against feature delivery pressure?
- Describe a time you had to make a call with incomplete data during an outage.
- How do you keep an on-call rotation healthy and sustainable as the team scales?
- Tell me about a time you cut cost and it went wrong. What did you learn?
- How do you run a blameless post-mortem that actually changes behavior?
How to answer this area — the operational-excellence framework
Every operational question can be answered with the same spine. Walk it in order and you will hit the signals interviewers look for without sliding into a war story about one outage.
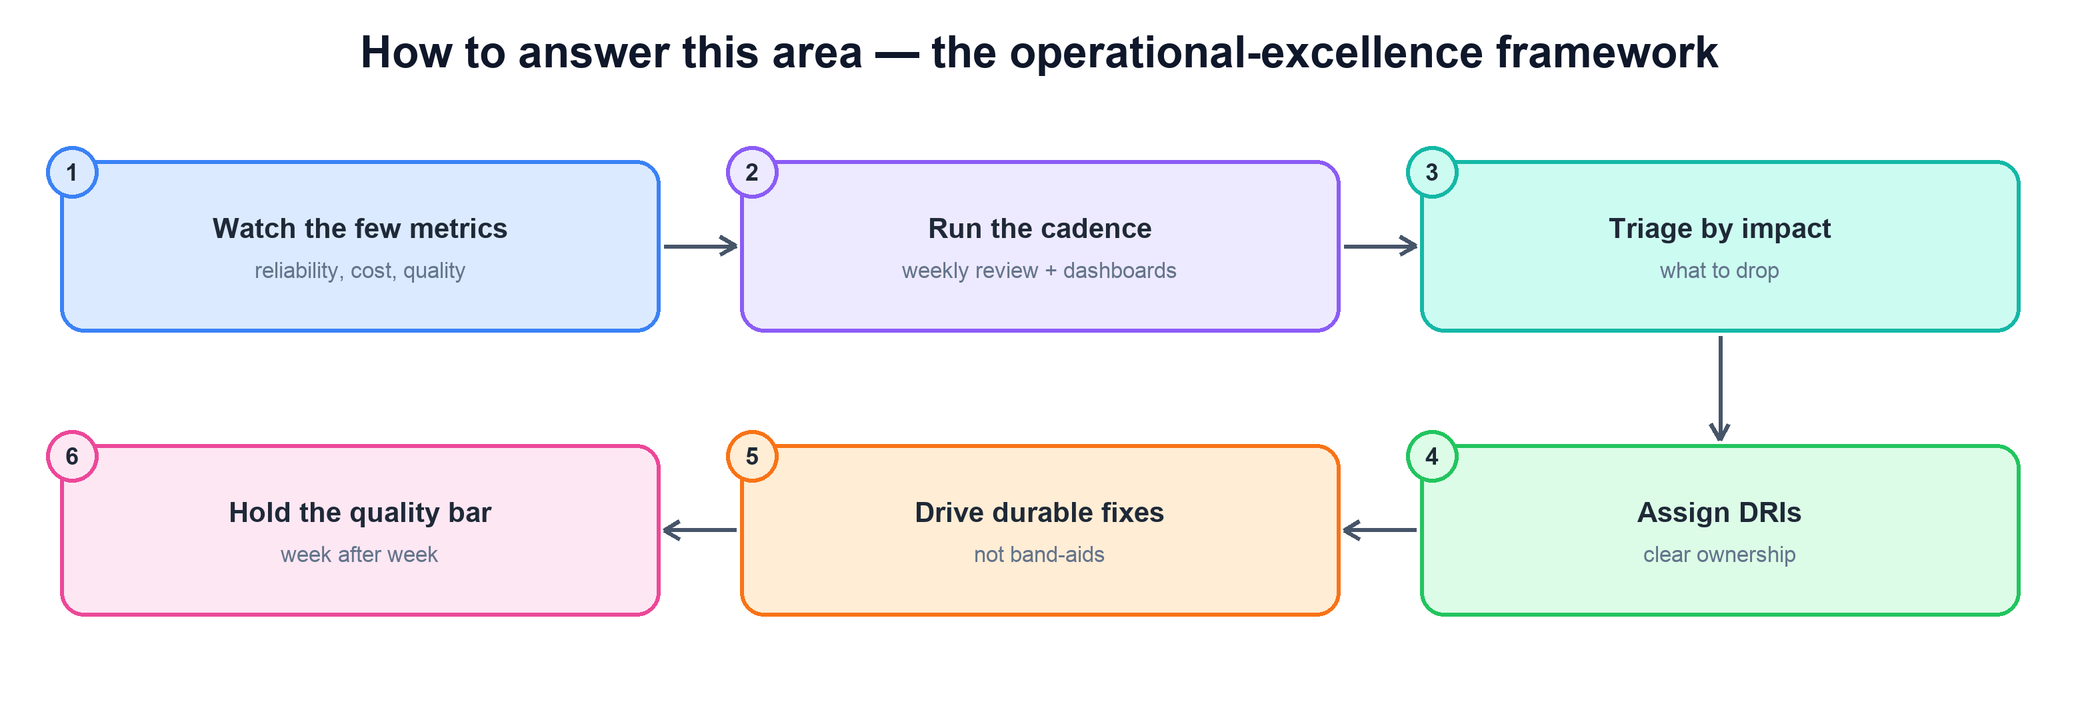
- Watch the few metrics. Name the small set of signals that actually predict health — reliability, cost, quality — and ignore the vanity dashboards.
- Run the cadence. A weekly review against live dashboards beats heroics; the cadence is what catches problems while they are still small.
- Triage by impact. When you can't do everything, decide what to drop on impact, not on who is loudest. Saying what you didn't fix is a seniority signal.
- Assign DRIs. Every issue gets one named owner accountable to closure — no shared ownership, no orphaned action items.
- Drive durable fixes. Push past the band-aid to the root cause; an outage that recurs is an operating failure, not bad luck.
- Hold the quality bar. Standards only count if they survive the week you are under pressure. Show how the bar held when it was expensive to hold.
- A small, defensible set of health metrics — not a dashboard with forty charts.
- A repeatable cadence that catches problems early, not reactive firefighting.
- Real triage: a costly thing you chose not to fix, and why.
- "I" for the operating decisions, "we" for how the team executed.
- ODS metrics + Unidash — pull from your reliability, cost, quality, and delivery dashboards for the health signals you watched.
- SEV tool — pull SEV trends to show incident volume and severity moving over time.
- GSD — pull from the operational-tasks project to show issues tracked to closure with owners.
- Weekly ops-review docs on the wiki — pull from the recurring review notes that prove the cadence existed.
How do you run your team's operations and stay on top of its health?
The foundational question for this area. They want to see a system for staying ahead of problems — not a description of how hard your team works when something breaks.
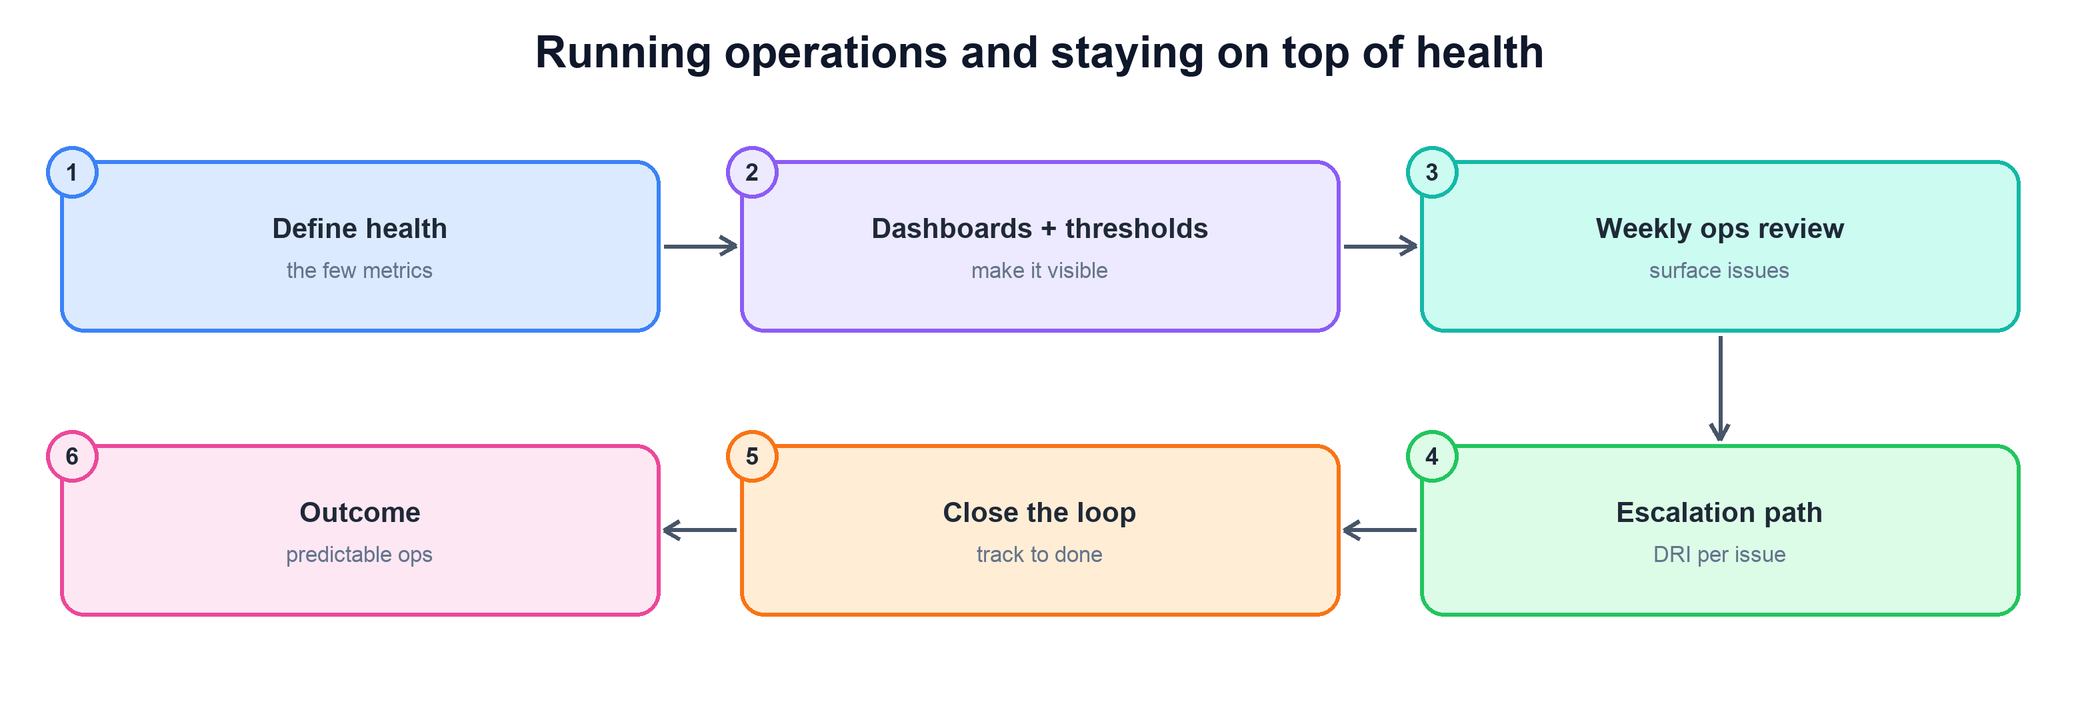
- Start by defining health — the few metrics that actually predict whether the system is in trouble, and why you chose those.
- Make health visible with dashboards and thresholds so a degradation is obvious before a customer notices it.
- Describe the weekly ops review where the team looks at the signals together and surfaces issues while they are cheap to fix.
- Give every issue an escalation path with a DRI, so nothing falls between owners.
- Close the loop: track each issue to done and confirm the metric recovered — then describe the predictable, low-surprise ops state you reached.
- A deliberate operating model, not ad-hoc reaction.
- Leading indicators and thresholds, not lagging post-mortems only.
- Clear ownership: one DRI per issue, tracked to closure.
- Evidence the system became more predictable over time.
- ODS metrics + Unidash — pull from your reliability and quality dashboards for the health signals and thresholds.
- SEV tool — pull SEV trends to show incidents trending down as the cadence matured.
- GSD — pull from the operational-tasks project for issues opened, owned, and closed.
- Weekly ops-review docs on the wiki — pull from the review notes that document the cadence.
Tell me about a time you drove a significant cost or efficiency improvement.
This question tests whether you can find the biggest lever with data, make a real change with a real tradeoff, and prove the savings — without quietly breaking reliability to get them.
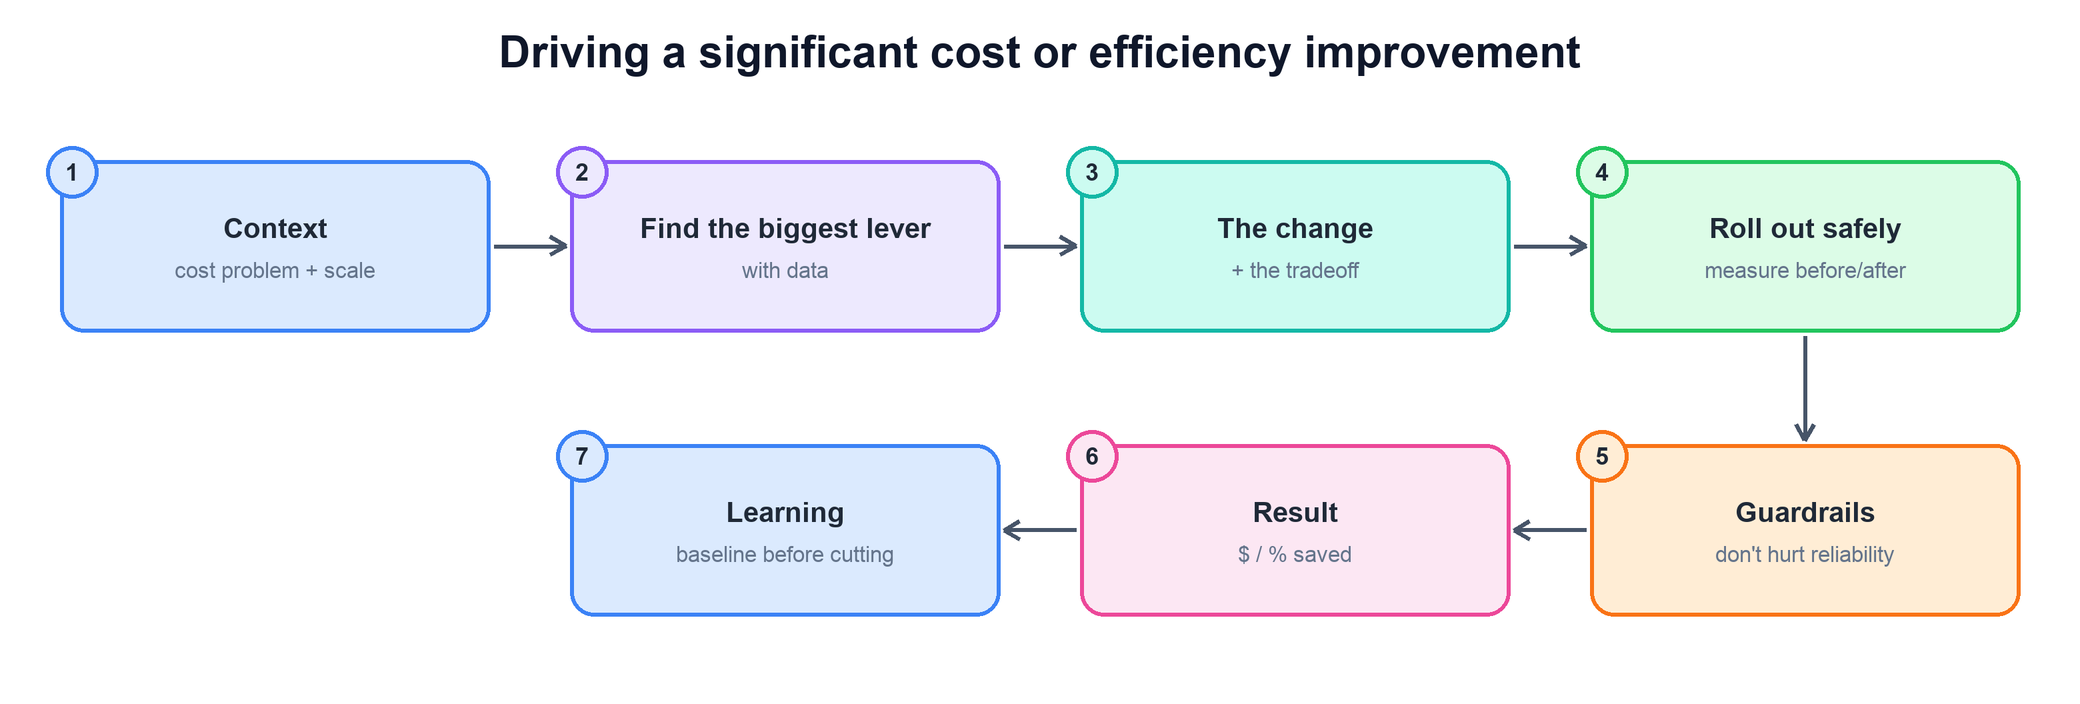
- Open with the context and scale: what the cost problem was and why it was worth your time.
- Show how you found the biggest lever with data — you went after the dominant cost driver, not the easiest one.
- Name the change and the tradeoff you accepted; an efficiency win with no tradeoff usually means you didn't look hard enough.
- Roll out safely with a baseline captured up front, so the before/after number is credible.
- Describe the guardrails that kept reliability whole, land a quantified result in dollars or percent, and close with the learning — baseline before you cut.
- Data-driven lever-finding, not across-the-board belt-tightening.
- An explicit tradeoff you owned, not a free lunch.
- A baseline captured before the change, so the savings are real.
- Reliability protected — cost won without a quality regression.
- Capacity / efficiency tooling — pull the cost numbers and the before/after baseline from your efficiency tooling.
- ODS metrics + Unidash — pull from the cost and reliability dashboards to show savings without a reliability hit.
- GSD — pull from the operational-tasks project for the efficiency workstream and its milestones.
- Weekly ops-review docs on the wiki — pull from the review notes where you tracked the savings landing.
Tell me about a time everything was on fire at once. How did you triage, and how did you protect quality under pressure?
The signal here is composure and prioritization under load: with more fires than hands, can you sequence the response, protect the team, and refuse to mortgage quality for speed.
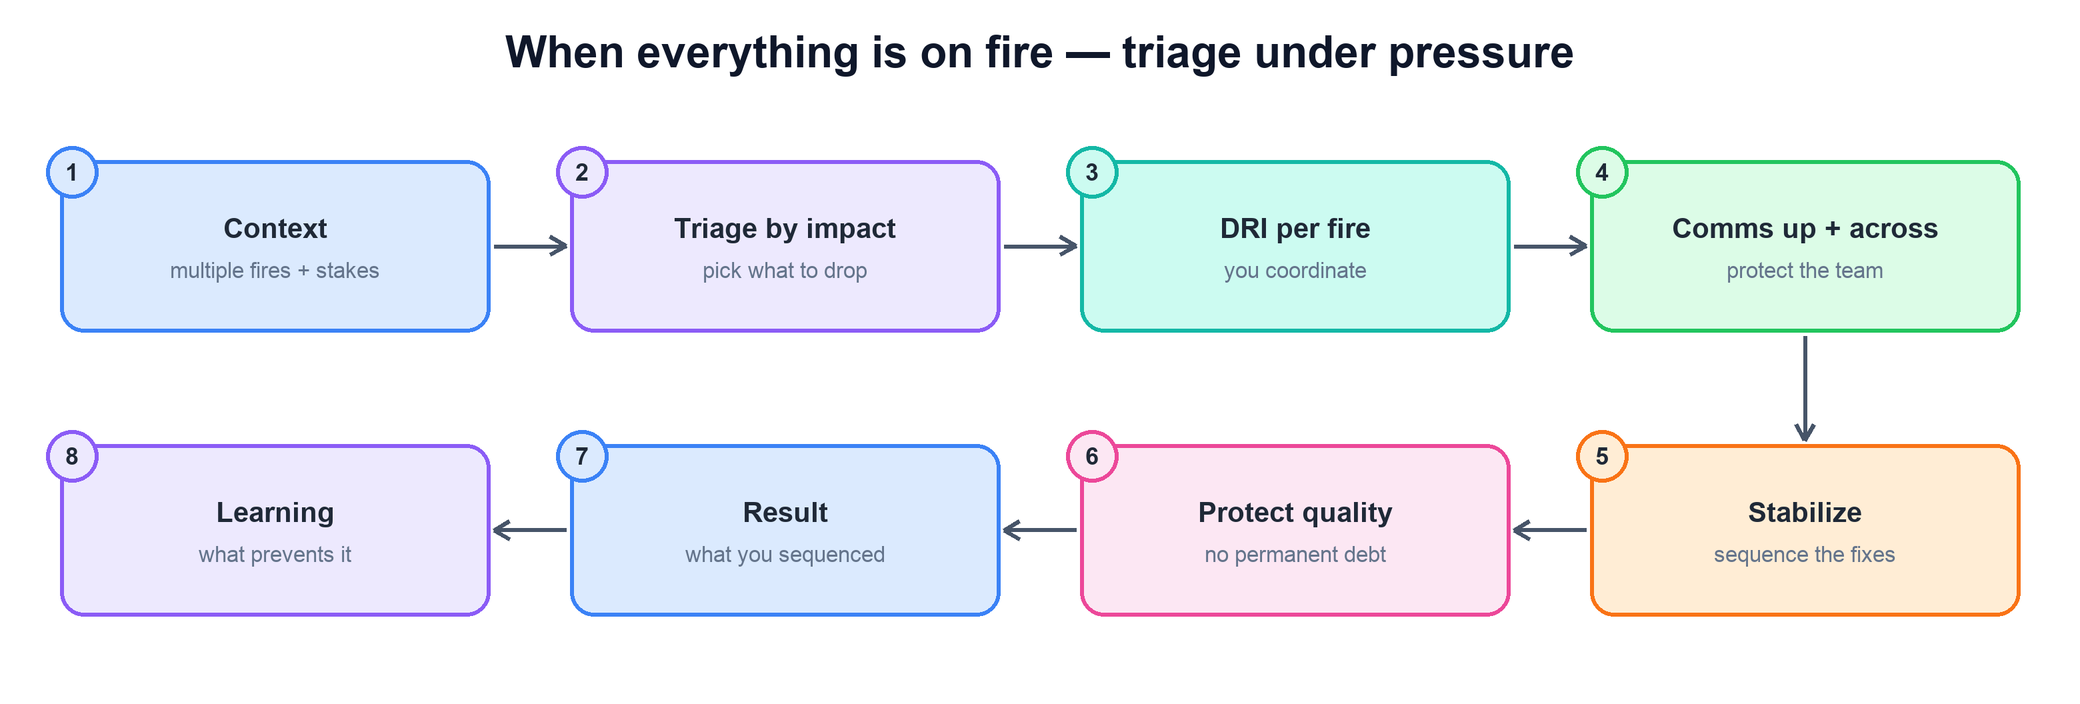
- Set the context and stakes: multiple concurrent fires and what was actually at risk.
- Triage by impact and say out loud what you chose to drop — the willingness to let a low-impact fire burn is the seniority signal.
- Put a DRI on each fire while you stay at the coordination layer rather than diving into one yourself.
- Run comms up and across so leadership and partners are calm, and the team is shielded from the churn.
- Stabilize by sequencing the fixes, protect quality so no permanent debt is left behind, then state the result and the learning about what prevents the next pile-up.
- Impact-based triage and a deliberate, named drop.
- Delegation under pressure — a DRI per fire, you coordinating.
- Calm comms that protected both stakeholders and the team.
- Quality held: no permanent debt taken on for short-term relief.
- SEV tool — pull the concurrent SEVs, their severity, and the timeline of how you sequenced them.
- ODS metrics + Unidash — pull from the reliability dashboards to show recovery and that quality held.
- GSD — pull from the operational-tasks project for the follow-up fixes and the DRIs.
- Weekly ops-review docs on the wiki — pull from the post-incident review notes for the prevention learning.
How do you set and hold a quality bar as the team grows?
An added question. As headcount climbs, quality drifts unless it is made explicit and built into the process. They want to see you define "good," bake it in, and keep it intact when delivery pressure rises.
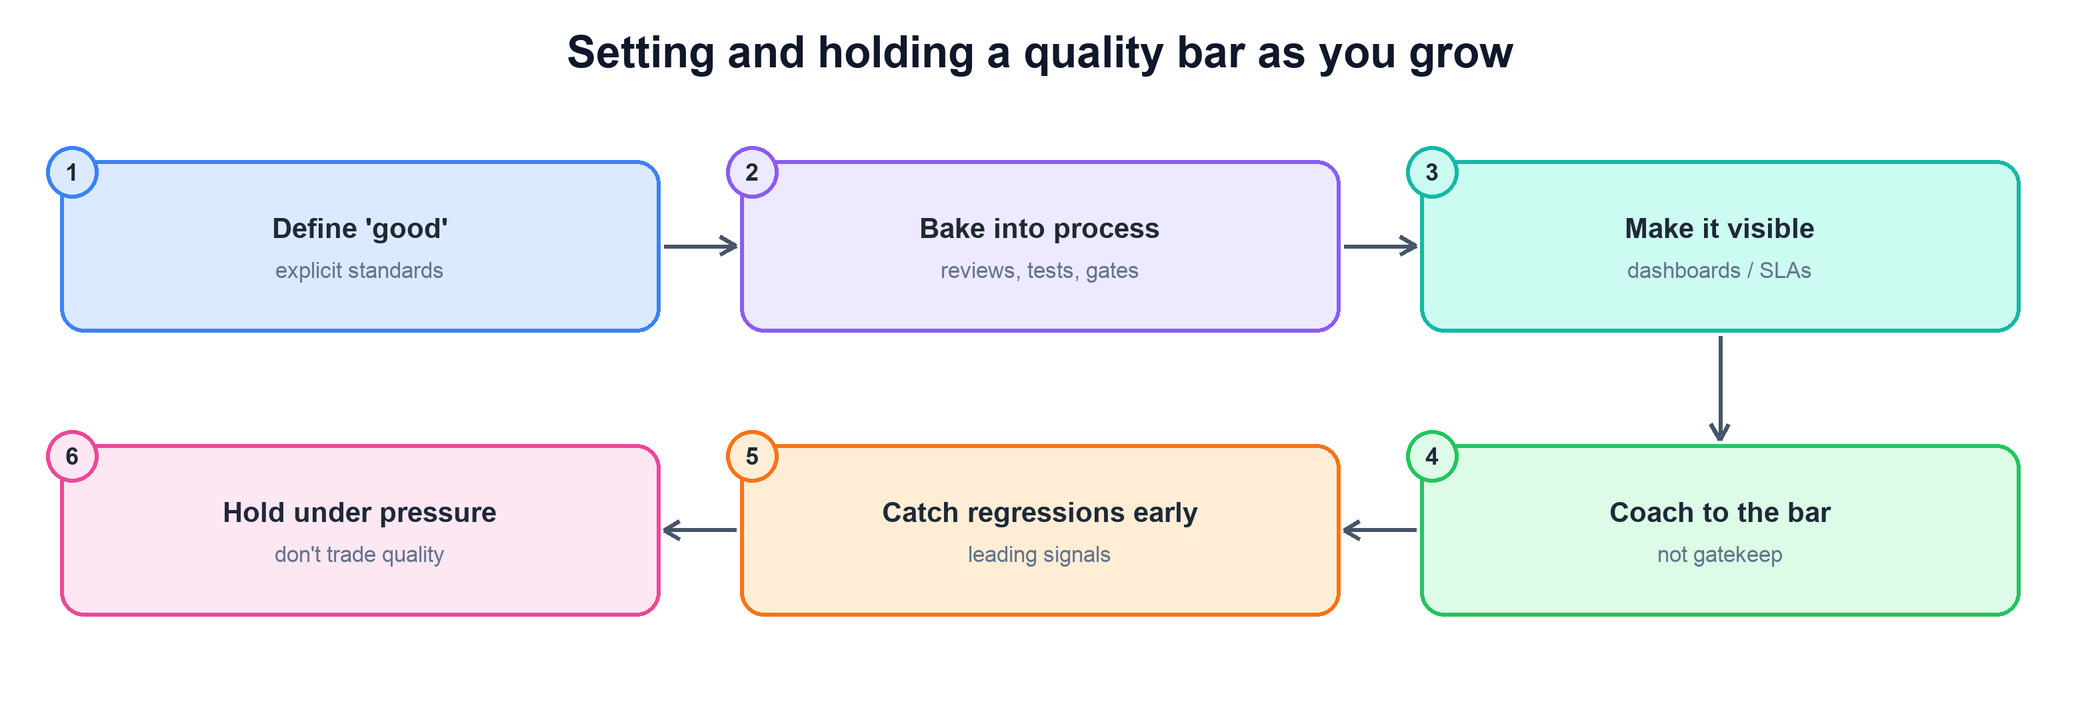
- Start by defining "good" explicitly — standards a new engineer can read and apply, not a feeling in your head.
- Bake the bar into the process: code review norms, test requirements, and gates that make the easy path the high-quality path.
- Make quality visible with dashboards or SLAs so a slip is obvious to the whole team, not just to you.
- Coach to the bar instead of gatekeeping: scale quality by raising people, not by being the only reviewer who says no.
- Catch regressions early with leading signals, and show a moment you held the bar under pressure when it would have been easier to ship and skip it.
- An explicit, written standard — not tribal knowledge.
- Quality built into process and tooling, so it scales past you.
- Coaching that raises the team, not a personal gatekeeping bottleneck.
- The bar held when delivery pressure made it costly.
- ODS metrics + Unidash — pull from the quality and delivery dashboards for defect, test-coverage, or SLA trends.
- SEV tool — pull SEV trends to show quality holding as the team scaled.
- GSD — pull from the operational-tasks project for the quality workstream and gate adoption.
- Weekly ops-review docs on the wiki — pull from the review notes that document the standards and where they held.
Tell me about building an operational-review or metrics culture.
An added question. The signal is installing a durable operating habit: moving a team from reactive firefighting to a regular review where the data drives the decisions.
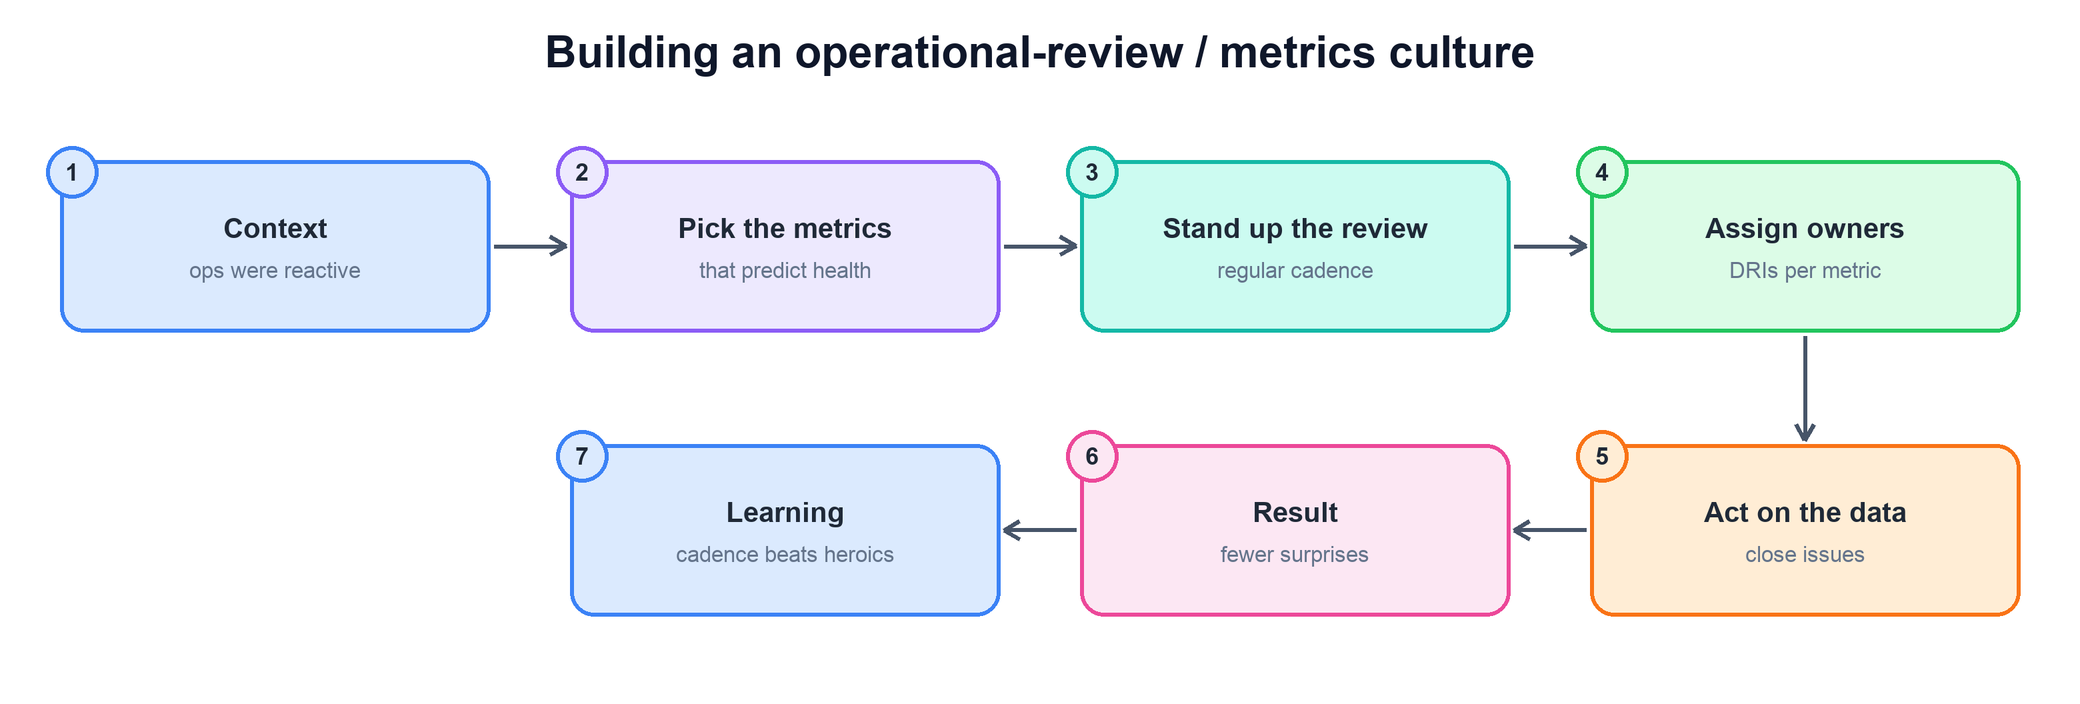
- Open with the context: operations were reactive and surprises kept landing late.
- Pick the metrics that predict health — the leading signals, not the comfortable ones — and explain why those.
- Stand up the review on a regular cadence so the team looks at the data together before problems compound.
- Assign owners per metric so each signal has a DRI who answers for its trend.
- Act on the data to close issues — a review that doesn't change behavior dies — then land the result (fewer surprises) and the learning that cadence beats heroics.
- A genuine culture shift from reactive to proactive, not a one-off meeting.
- Metrics chosen for predictive value, with an owner each.
- The review changing behavior — issues closed, not just discussed.
- A durable habit that outlived your direct attention.
- ODS metrics + Unidash — pull from the reliability, cost, and quality dashboards that anchored the review.
- SEV tool — pull SEV trends to show surprises dropping after the cadence took hold.
- GSD — pull from the operational-tasks project for issues the review generated and closed.
- Weekly ops-review docs on the wiki — pull from the recurring review notes that prove the cadence stuck.
More questions you might get — Operational Leadership
All of these reduce to the same spine: watch the few metrics, run a cadence, triage by impact, give owners and durable fixes, and protect quality. Have a story ready for each.
How do you decide which metrics are worth tracking — and which dashboards to delete?
How to answer- Tie every metric to a decision — if no action changes when it moves, it is noise, not a signal.
- Favor leading indicators that predict health over lagging counts that only confirm the damage.
- Keep the set small and defensible: a handful that predict reliability, cost, and quality beats a wall of forty charts.
- Delete on a cadence — retire dashboards no one acts on, so attention stays on the few that matter.
Tell me about a recurring incident. How did you break the cycle for good?
How to answer- Context: name the incident that kept recurring and what each repeat actually cost.
- Find the root cause, not the symptom — a repeat fire means the band-aid never reached the real defect.
- Drive a durable fix with a DRI and a guardrail that makes the failure mode impossible, not just unlikely.
- Results and learning: show the recurrence rate dropping to zero and the mechanism that catches the next one early.
How do you balance reliability investment against feature delivery pressure?
How to answer- Make the tradeoff explicit with an error budget or SLA, so the choice is a number, not a gut feeling.
- Let the signal gate the work: when reliability is in budget, ship features; when it is spent, the team pays down debt.
- Frame reliability as enabling delivery — an unstable system slows every future feature, so the investment compounds.
- Decide by impact and say what you deprioritized, so the balance reads as judgment rather than avoidance.
Describe a time you had to make a call with incomplete data during an outage.
How to answer- Context: set the stakes and the unknowns — what you did and did not know when the clock was running.
- Decide on the safest reversible move first; mitigate impact before you fully understand the cause.
- Reason from impact and a hypothesis, state your assumptions out loud, and keep comms flowing while you act.
- Results and learning: show the outcome and the instrumentation you added so the next call is made with data.
How do you keep an on-call rotation healthy and sustainable as the team scales?
How to answer- Measure the load — track pages per shift and toil, and treat a noisy rotation as a bug to fix, not a tax to absorb.
- Attack alert fatigue: tune or delete low-value alerts so every page is real and actionable.
- Invest in runbooks and automation so responders are not improvising at 3am, and rotate fairly across the team.
- Feed pain back into the backlog — recurring pages become prioritized fixes, keeping the rotation durable as headcount grows.
Tell me about a time you cut cost and it went wrong. What did you learn?
How to answer- Context: the cost you targeted and the cut you made — own it plainly rather than softening it.
- Name what broke: the reliability or quality regression the cut caused because a guardrail or baseline was missing.
- Actions to recover: how you detected it, rolled back, and restored health with clear ownership.
- Learning: baseline and guardrail before you cut, and roll out behind a measured before/after so regressions surface early.
How do you run a blameless post-mortem that actually changes behavior?
How to answer- Focus on systems, not people — ask what let the failure happen, so people surface the real cause without fear.
- Drive to root cause with a timeline and a few honest contributing factors, not a single scapegoat.
- Produce owned, dated action items with a DRI each — a post-mortem with no tracked follow-through is theater.
- Close the loop: track the items to done and show recurrence dropping, proving the review changed behavior.