Defining Success for a Platform Team
Final Prep · People Management — how you set clear, motivating performance metrics (OKRs/KPIs) for an infrastructure or platform team whose output is systemic stability and developer velocity rather than a flashy customer-facing feature.
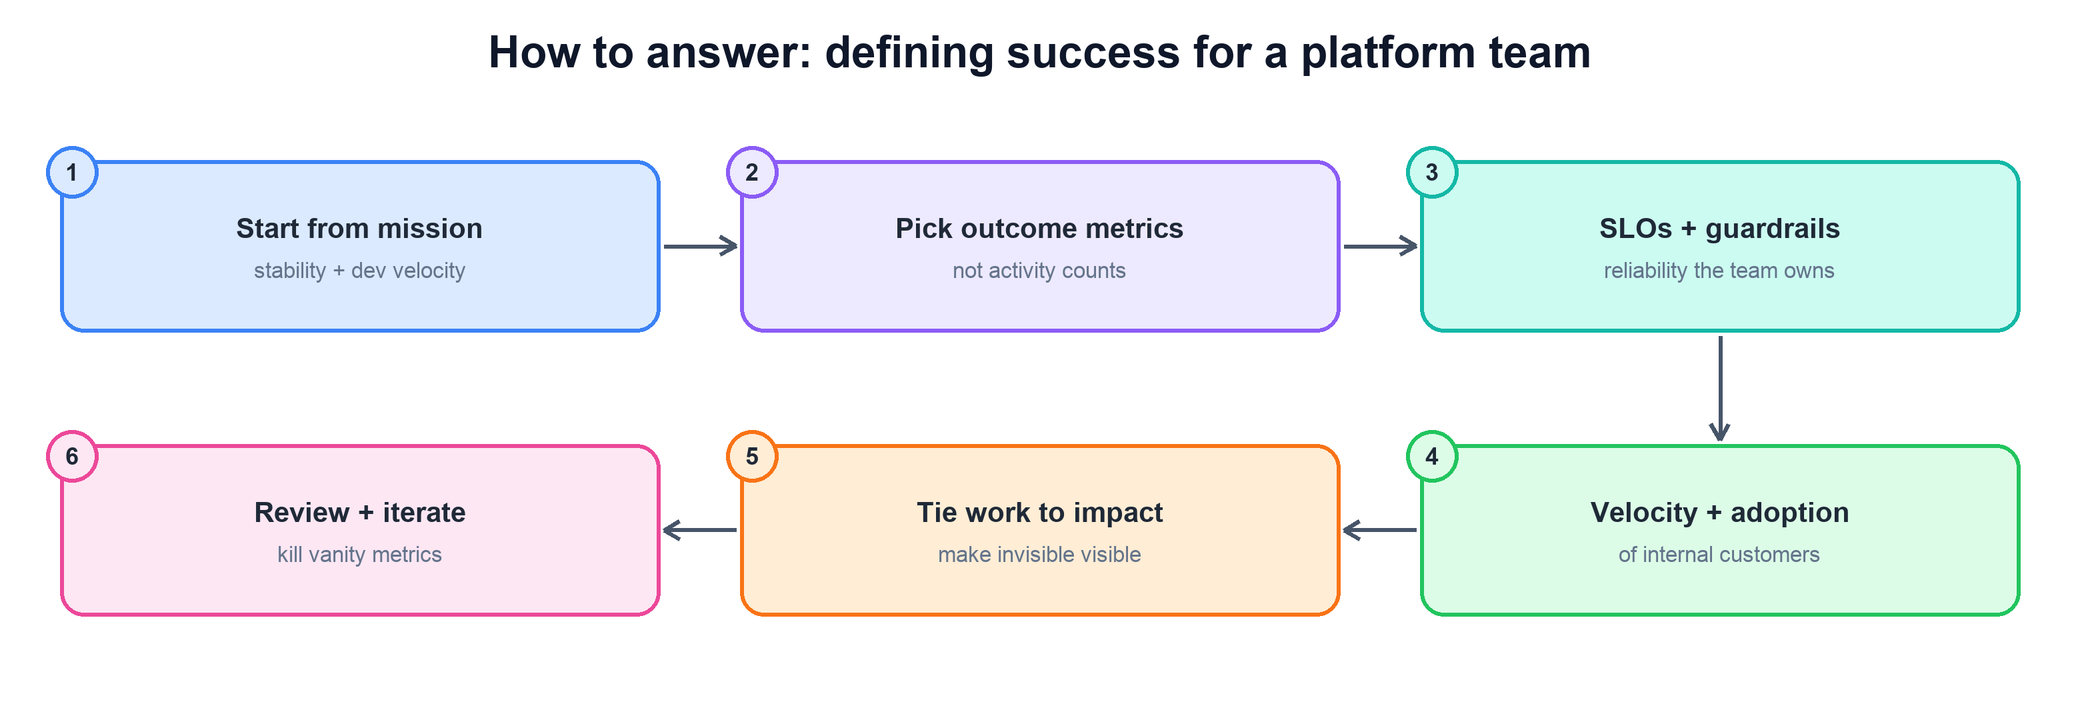
This question separates managers who measure activity from managers who measure impact. A weak answer reaches for whatever is easy to count — tickets closed, diffs landed, uptime as a single vanity number — and ends up with a team that games the metric while the platform quietly rots. The interviewer wants to see that you start from the platform’s mission, choose outcome metrics over activity metrics, express reliability as SLOs and guardrails the team genuinely owns, measure developer velocity and adoption by your internal customers, and make the invisible work of infrastructure visible and motivating — then review and prune the metrics as they drift. Answer in CARL shape (Context, Actions, Results, Learnings), with most of your words on the actions.
What this question is really testing
Two things. First, whether you understand platform value: infrastructure success is systemic and often invisible — the reward for great storage work is that nobody notices it — so a leader who can only measure shipped features will demoralize and misdirect the team. Second, whether your metrics drive the right behavior: every metric is an incentive, and the classic failure is choosing numbers that are easy to count but easy to game, so the team optimizes the dashboard instead of the outcome. The interviewer wants a leader who picks a small set of outcome-oriented metrics that align the team’s daily work with reliability and developer productivity, and who keeps revisiting whether those metrics still mean anything.
How to answer- Anchor on the mission first. Name what the platform exists to deliver — systemic stability and developer velocity for its customers — before you name a single metric, so every number traces back to a purpose.
- Choose outcomes, not activity. Measure the effect on customers (reliability experienced, time saved, adoption) rather than the team’s motion (tickets, diffs, meetings) — activity counts reward looking busy, not creating value.
- Make reliability an owned SLO with guardrails. Express stability as SLOs and error budgets the team controls — not a single “uptime” vanity number — and pair every efficiency or velocity goal with a reliability guardrail so speed can’t be bought by breaking things.
- Measure developer velocity and adoption. Track how much faster and more safely your internal customers ship because of the platform — migration completion, self-serve adoption, reduced toil, time-to-onboard — because that is the platform’s real product.
- Make the invisible visible, then prune. Surface the systemic wins that would otherwise go unseen (incidents prevented, capacity reclaimed, toil removed) so the work is motivating, and review the metric set regularly to kill anything being gamed or gone stale.
- Metrics that trace back to mission, not convenience.
- Outcome over activity — awareness that activity metrics get gamed.
- Reliability as SLOs / error budgets with guardrails, not a lone uptime figure.
- A real notion of developer velocity and internal-customer adoption.
- Making invisible infra work visible, and willingness to prune vanity metrics.
A worked example (CARL)
Context. I ran the Ads Events storage team — classic platform work: our customers were other engineering teams, and our best outcome was that they never had to think about us. The team was measured, loosely, by ticket throughput and a single uptime percentage, and it showed: morale was low because the number never captured the hard systemic work, and the incentives were subtly wrong — people gravitated to small, countable tasks over the unglamorous reliability and efficiency work that actually mattered. I needed a metric set that reflected real value and motivated the team.
Actions. I started from the mission rather than the dashboard: our job was to give Ads teams a storage layer that was reliable, efficient, and easy to build on. From that I defined a small set of outcome metrics in three buckets, deliberately small so the team could actually hold them in their heads. First, reliability as SLOs the team owned — latency and durability targets for our read and write paths with explicit error budgets — instead of one uptime number that hid the experience customers actually had; when we spent the error budget, reliability work automatically took priority over features, which made the tradeoff a rule rather than a debate. Second, developer velocity and adoption — how quickly customer teams could onboard to and migrate onto the platform, how much of our usage was self-serve versus hand-held, and how much manual toil we removed from their path — because those numbers are the platform’s real product. Third, efficiency, expressed as capacity reclaimed and cost-per-unit-of-storage trend, but I paired every efficiency goal with a reliability guardrail so nobody could hit an efficiency target by quietly eroding durability. I was explicit about what we were not going to measure: raw ticket counts and diff counts came off the wall entirely, because they rewarded motion over impact and were trivially gamed. Then I did the part that mattered most for morale — I made the invisible work visible. I built a simple review where we tracked incidents prevented, capacity reclaimed, and toil eliminated, and I made sure that systemic work showed up in perf and in how we talked about the team, so the engineers doing the unglamorous reliability work got the credit they’d been missing. Finally, I treated the metric set as living: we reviewed it each half and killed anything that had gone stale or was being optimized for its own sake.
Results. Within a couple of quarters the team’s work visibly reoriented toward the outcomes that mattered — reliability held to the SLOs even as we pushed hard on efficiency, because the guardrail forced the tradeoff into the open, and customer teams onboarded faster with far less hand-holding as self-serve adoption climbed. Just as important, morale improved: the engineers doing deep systemic work could finally see it reflected in how the team was measured and recognized, and the “busy work to look productive” pull faded once the activity metrics were gone.
Learnings. The biggest lesson is that for a platform team, the metric is the strategy — whatever you measure is what the team will optimize, so a lazy metric quietly steers good people toward the wrong work. The second is that reliability and efficiency must be measured as a paired tradeoff, never in isolation, or you incentivize winning one by silently sacrificing the other. And the third is that making invisible infrastructure work visible isn’t a nice-to-have — it’s the difference between a team that feels valued and one that burns out doing critical work nobody sees.
Common follow-ups
How do you avoid metrics that get gamed?
How to answer- Measure outcomes, not activity. Countable motion — tickets, diffs, deploys — is the easiest thing to game; effects on customers are much harder to fake.
- Pair every metric with a guardrail. Balance speed with a reliability floor and efficiency with a durability floor so you can’t win one by breaking the other.
- Watch for the metric replacing the goal. When a number becomes a target it stops being a good measure — review for optimization-for-its-own-sake and retire it.
- Keep the set small. A few well-chosen metrics are harder to game and easier to reason about than a sprawling dashboard nobody trusts.
How do you measure developer velocity without counting output?
How to answer- Measure friction removed, not lines shipped. Time-to-onboard, time-to-first-safe-change, and toil eliminated capture the platform’s effect on its customers.
- Track adoption and self-serve rate. How much usage is self-serve versus hand-held shows whether the platform genuinely accelerates people.
- Use customer-team outcomes. Faster, safer shipping by the teams you serve is the real velocity number — borrow their signal, not your own throughput.
- Listen qualitatively too. Structured customer feedback catches friction that no dashboard shows and keeps you honest about lived experience.
How do you show impact when success is “nothing broke”?
How to answer- Count the counterfactual. Surface incidents prevented, capacity reclaimed, and near-misses caught early — the value is in the bad things that didn’t happen.
- Trend the SLOs and error budget. A stable, well-managed error budget is concrete evidence that reliability is being actively earned, not luck.
- Translate into business terms. Frame reliability and efficiency wins in cost saved and customer trust preserved so leadership sees the impact clearly.
- Give the quiet work a stage. Put systemic wins into perf, reviews, and team narrative so invisible work becomes recognized work.
How do you set OKRs when leadership wants a flashy feature number?
How to answer- Reframe to the mission. Translate the ask into the platform’s real levers — reliability, velocity, efficiency — and show how those enable the flashy outcomes upstream.
- Connect infra work to business impact. Tie the platform metrics to the revenue or product goals they unblock so leadership sees the line.
- Hold the guardrails. Push back on a feature target that would spend reliability you can’t afford — name the tradeoff explicitly rather than absorbing it silently.
- Offer one shared headline. Give leadership a single legible outcome metric on top of the team’s working set, so both audiences are served without gaming the team’s incentives.
- SLO / oncall dashboards — pull the reliability targets, error-budget burn, and incident trends that make stability an owned, measurable outcome.
- OKR / half-planning docs — pull the outcome-oriented goals and guardrails, and the activity metrics you deliberately removed.
- GSD — pull migration completion, adoption, and toil-reduction milestones as evidence of developer velocity.
- Capacity / efficiency dashboards — pull reclaimed capacity and cost-per-unit trends paired with their reliability guardrails.
- Customer-team feedback / Workplace — pull the qualitative signal on friction and adoption from the internal teams you serve.