Reviewing for Performance, Scalability & Reliability
The code is correct. Now: what does it cost per event, and what breaks when traffic doubles?
For an engineer coming from high-throughput ad-events infrastructure, this is home turf and the interviewer knows it. The question is whether you can spot the performance and reliability footguns that don't show up in a functional test — the ones that pass in review, pass in staging at 1x load, and then take down a service at peak. A correct algorithm with an accidental N+1, an allocation in a per-event loop, an unbounded cache, or a missing timeout is a latent incident. Your job as a reviewer is to read a diff for its behavior at scale and under failure, not just its behavior on the happy path with one request.
What this question is really testing
Whether you carry a cost model in your head while you read code. Anyone can say “check for performance.” The signal is specificity: you locate the hot path first (what executes per request or per event), then you know the concrete anti-patterns to look for and why each one bites at scale. It also tests whether you treat reliability as part of performance — timeouts, retries, backpressure, and pool sizing are what keep a fast system from becoming a cascading-failure amplifier.
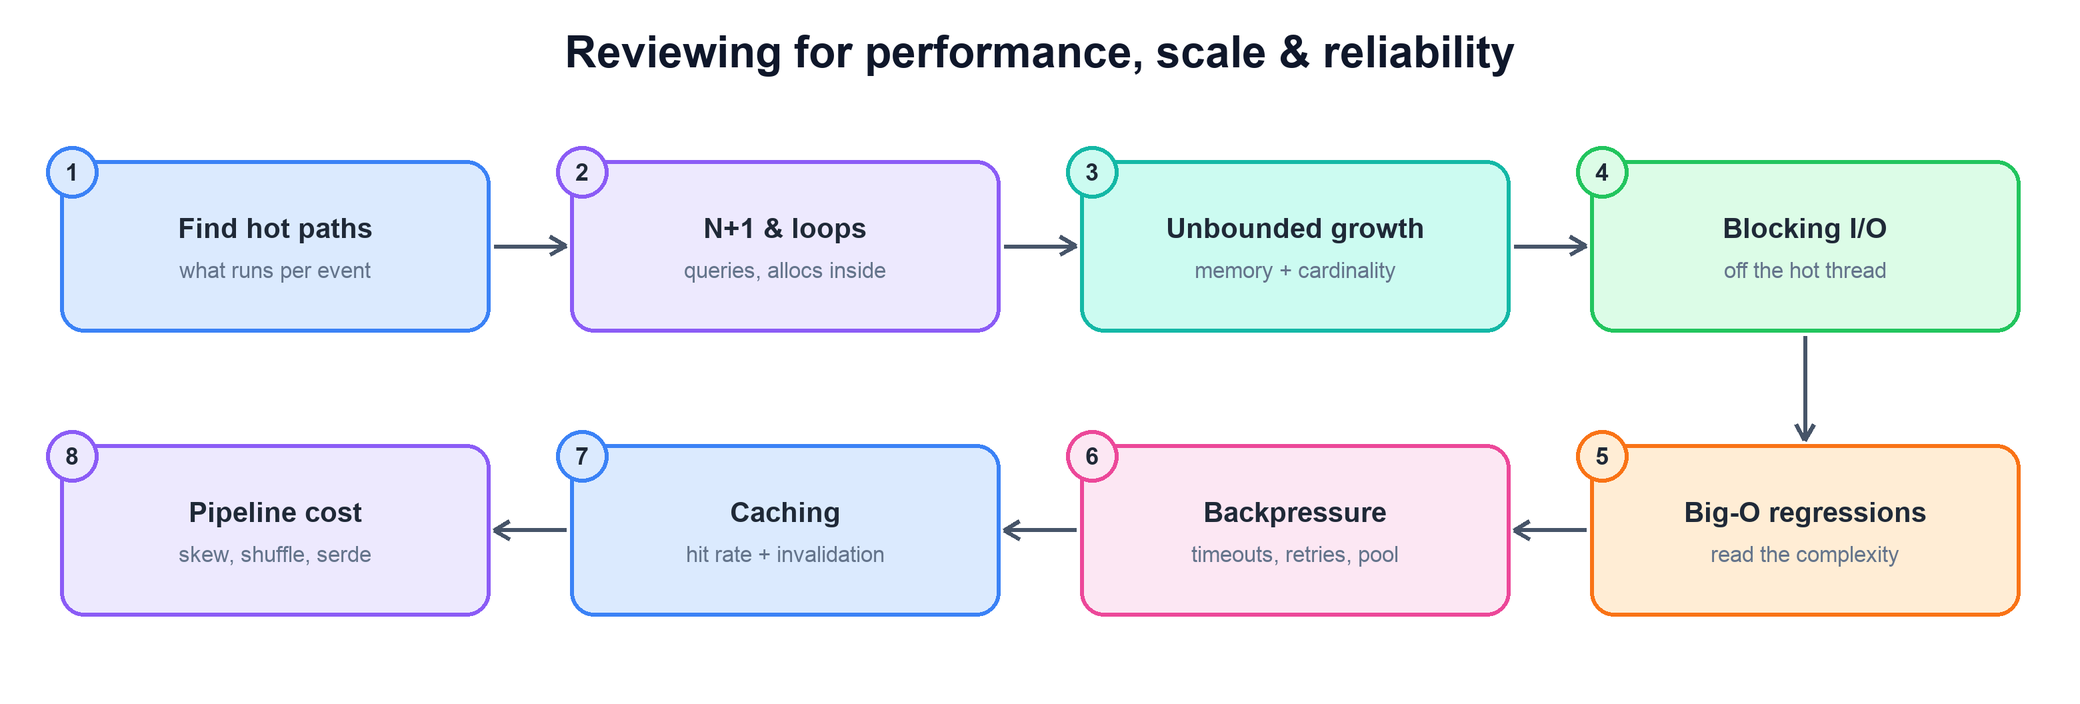
How to answer- Find the hot path first. Ask what runs per request or per event versus once at startup. A wasteful line in initialization is fine; the same line inside a per-event loop processing a million events a second is a fire. Frame everything relative to call frequency.
- N+1 queries and work inside loops. The classic: a query or RPC per item in a collection instead of one batched call. Same shape for allocations, regex compilation, logging, and lock acquisition moved inside a loop that should be hoisted out.
- Unbounded memory and cardinality. Any collection, cache, buffer, or map that grows with input and never evicts is an OOM waiting for the right traffic. Watch metric labels and log keys built from unbounded values (user IDs, URLs) — that's cardinality explosion in your monitoring bill.
- Blocking I/O on the wrong thread. A synchronous network or disk call on an event loop, request handler, or a shared thread pool serializes everything behind it. Look for blocking calls that should be async or off-loaded.
- Big-O regressions. A nested loop that quietly turned an O(n) pass into O(n²), a sort inside a loop, a linear scan where a map lookup belongs. These are invisible at test scale and quadratic at production scale.
- Backpressure, timeouts, and retries. Every remote call needs a deadline. Every retry needs a bound and backoff with jitter, or you build a retry storm that DDoSes your own dependency. Ask where backpressure lives when a downstream slows down — unbounded queues just move the OOM.
- Connection-pool and resource misuse. A connection or client created per call instead of pooled, a pool too small (serialization) or too large (thundering herd on the DB), a resource leaked because it's not closed on the error path.
- Caching. Is the cache actually helping — realistic hit rate, sane key, bounded size, correct invalidation? A cache with a bad invalidation story trades a performance problem for a correctness one.
- Data-pipeline performance. For batch/stream work: data skew (one hot key stalls a reducer), unnecessary shuffles, serialization cost (a chatty format or per-record serde), and small-file / partition problems. These dominate pipeline runtime far more than the map logic does.
- You anchor on the hot path and call frequency before critiquing anything.
- Named, specific anti-patterns — N+1, cardinality, retry storm, skew — not vague “make it faster.”
- Reliability folded into performance: timeouts, bounded retries, backpressure.
- Awareness that observability cost (cardinality) is a real production cost.
- “Measure before optimizing” discipline — you ask for a profile/benchmark rather than guessing, and you don't demand premature optimization off the hot path.
A concrete before/after that captures the most common catch — an N+1 plus an allocation inside a per-event loop:
# WRONG: one RPC per event, new client + list built inside the hot loop
def enrich(events):
    out = []
    for e in events:                      # runs per event, millions/sec
        client = DimClient()              # new connection every iteration
        dim = client.lookup(e.campaign_id) # N+1: one round trip each
        out.append(merge(e, dim))
    return out

# RIGHT: batch the lookup, reuse the pooled client, size the result
def enrich(events, client):               # pooled client injected
    ids = {e.campaign_id for e in events}
    dims = client.batch_lookup(ids)       # one round trip, bounded fan-out
    return [merge(e, dims[e.campaign_id]) for e in events]
Common follow-ups
You suspect a perf problem but there's no benchmark. What do you do?
How to answer- Ask for the measurement, don't block on a guess. Request a profile, a micro-benchmark, or the expected call frequency — “measure before optimizing” cuts both ways.
- Reason about the hot path. If it's clearly per-event and clearly O(n²) or an N+1, that's a design concern worth raising even before numbers.
- Distinguish latent from realized. A slow path that runs once at deploy is a nit; the same on the ingestion path is blocking.
How do you review retry logic?
How to answer- Bounded attempts, exponential backoff, jitter. Unbounded or synchronized retries are a self-inflicted DDoS on a struggling dependency.
- Only retry the retryable. Retrying a non-idempotent write or a 4xx just amplifies harm; pair retries with idempotency keys.
- Budget and shed. Look for a retry budget / circuit breaker so retries stop when the downstream is clearly down.
What performance issues are specific to data pipelines?
How to answer- Skew. One hot key (a null, a whale advertiser) sends most rows to one reducer; look for salting or a skew-join strategy.
- Shuffle and serialization. Unnecessary repartitions and a chatty record format dominate runtime; prefer columnar formats and fewer wide shuffles.
- Partitioning and small files. Too many tiny partitions or output files crush the scheduler and downstream readers.
How do you avoid over-optimizing in review?
How to answer- Weight by the hot path. Off-path code doesn't need micro-tuning; demanding it is premature optimization that hurts readability.
- Correctness and clarity first, then measured perf. Don't trade a clear design for a speculative speedup with no benchmark.
- Block only on real, scaled risk. Everything else is a “nit / consider later.”
- Scuba / ODS / Unidash — the latency, throughput, CPU, and memory dashboards that show the hot path and any regression before/after a change.
- Phabricator — a review where you caught an N+1, an unbounded allocation, or a missing timeout, with the profile that backed it.
- SEV / postmortems — an incident from a retry storm, cardinality explosion, or pool exhaustion, and the review guardrail it produced.
- Strobelight / profilers — CPU/allocation profiles you used to move an optimization from opinion to data.
- Internal wiki — the perf/reliability review checklist (timeouts, backpressure, pooling) your team holds.