Reviewing for Observability & Operability
The real test of a diff: can the on-call who has never seen this code debug it at 2 AM with only the dashboards?
Code that works but can't be observed is a future outage with no flashlight. This question tests whether you review changes for their operational life — not just “is it correct” but “when it breaks, will we know, and will we be able to find out why fast.” For someone from storage and events infra, where you've carried the pager, this should be a strength. A new code path with no metric, a failure that logs nothing, an alert that pages on a symptom no one can act on — these are the things a senior reviewer catches before they become a 3 AM mystery.
What this question is really testing
Whether you own the 2 AM debuggability of code you approve. The signal is that you treat instrumentation as part of the feature, not an afterthought, and that you know the vocabulary — RED/USE, structured logging, correlation IDs, traces, actionable alerting — and the cost model behind it. It also tests judgment: more telemetry isn't automatically better; high-cardinality metrics and chatty logs have a real bill and can bury the signal.
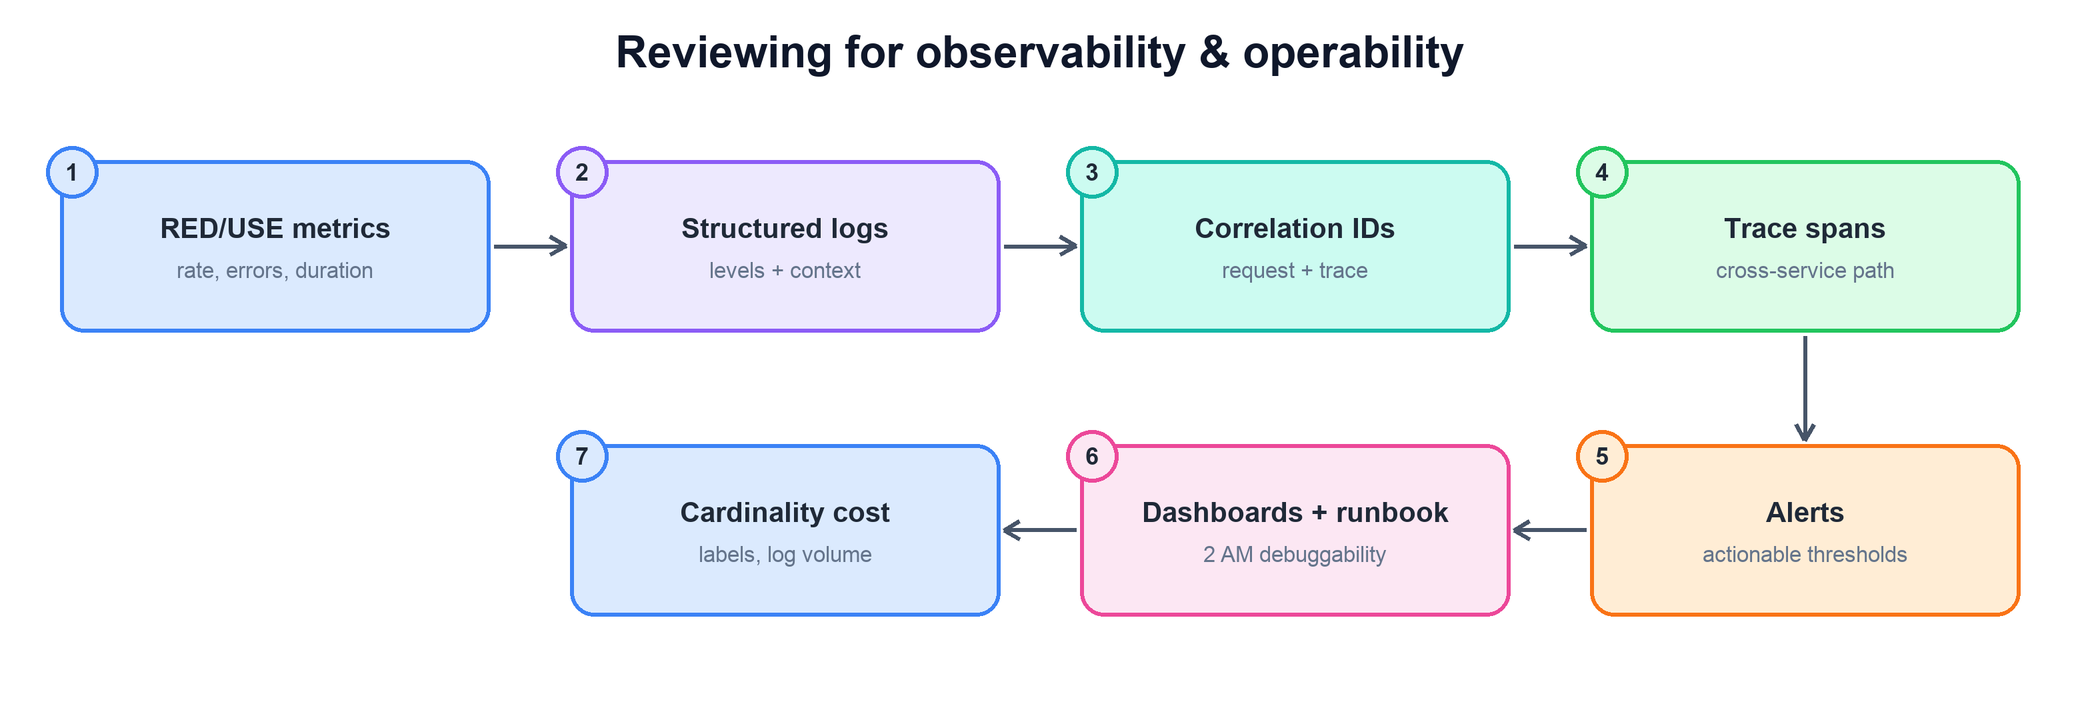
How to answer- Metrics on every new path (RED/USE). RED for request-driven services — Rate, Errors, Duration. USE for resources — Utilization, Saturation, Errors. A new endpoint, consumer, or failure branch that emits no counter or latency histogram is invisible; ask for it.
- Structured logs at the right level. Logs should be key-value, not string-concatenated prose, so they're queryable. Check log levels — errors at ERROR, not INFO; no per-event logging at INFO on the hot path (that's a cost and noise bomb). Every error path should say something actionable.
- Correlation and request IDs. A request/trace ID must propagate through logs and across service boundaries so you can stitch one request's story together. A log line with no correlation key is nearly useless in a distributed system.
- Trace spans. For multi-hop paths, look for spans around the meaningful operations (RPCs, DB calls, queue hops) so latency can be attributed to the right stage. A new remote call with no span is a blind spot in the trace.
- Actionable alert thresholds. Alerts should fire on symptoms users feel (error rate, latency SLO burn), be actionable, and point to a runbook. Reject alerts that page on causes no one can act on, or thresholds tuned to flap — alert fatigue is a reliability risk itself.
- Dashboards and runbooks. A significant new feature or failure mode should come with (or update) a dashboard and a runbook step. The reviewer's question: if this pages, does the on-call have a graph to look at and a documented next action?
- The 2 AM test. Read the diff as the on-call who didn't write it. Can they tell what broke, where, and why, from telemetry alone? If the answer is “only the author could debug this,” the observability is incomplete.
- Cardinality and cost. Metric labels and log keys built from unbounded values (user ID, URL, request ID as a metric label) explode cardinality and cost. Push high-cardinality identifiers into logs/traces, keep metric labels bounded, and sample high-volume logs.
- Instrumentation treated as part of the change, not a follow-up.
- Fluency with RED/USE, structured logging, correlation IDs, and tracing.
- The “can an on-call debug this at 2 AM” framing applied concretely.
- Alerts judged for actionability and anti-flap, not just presence.
- Cost awareness — cardinality and log volume as real constraints, more isn't always better.
Common follow-ups
How do you tell good instrumentation from noise?
How to answer- Tie every signal to a question. A metric or log should answer “is it healthy?” or “why did it break?” If it answers neither, cut it.
- Levels and sampling. Reserve ERROR/WARN for actionable events; sample high-volume INFO/DEBUG on the hot path.
- Bounded labels. Keep metric dimensions low-cardinality; push detail into logs/traces.
What makes an alert good vs bad?
How to answer- Symptom-based and actionable. Page on user-visible pain (SLO burn), not on a raw cause no one can fix at 2 AM.
- Runbook-linked. Every page should point to a documented next step.
- Anti-flap. Thresholds and durations tuned so it doesn't cry wolf — alert fatigue erodes response.
The team says instrumentation can be a follow-up diff. Agree?
How to answer- For risky paths, no. If it can page, it ships with observability — a follow-up that never lands is the default outcome.
- Right-size it. A trivial internal change doesn't need a dashboard; a new production path does.
- Make it a checklist item. Encode “new path -> metric + log + alert” so it isn't per-reviewer memory.
How do you review the cost of observability?
How to answer- Cardinality first. Unbounded metric labels are the top cost driver; flag IDs used as labels.
- Log volume and retention. Per-event logging at INFO on a hot path is a budget and signal-to-noise problem; sample it.
- Trace sampling. Full-fidelity tracing everywhere is expensive; sample and keep tail/error traces.
- ODS / Unidash / Scuba — the metrics and dashboards a new path should emit into, and the cardinality/volume cost you monitor.
- Phabricator — a review where you required a metric, a correlation ID, or an actionable alert on a new failure branch.
- SEV / postmortems — an incident prolonged by missing telemetry (blind failure mode) and the instrumentation guardrail it produced.
- Runbooks / on-call docs — the 2 AM-debuggability standard and the runbook a diff should update.
- Alerting config — the alert thresholds and SLOs your team holds, to judge actionability.